U.S. States That Ship the Most Goods to Other States [2022 Edition]
The last few years have starkly shown how interconnected the world has become. The COVID-19 virus spread across borders and regions with ease, disrupting communities and economies across the globe.
One of COVID’s biggest ripple effects was the impact on global supply chains. Suppliers worldwide operated through much of 2020 and 2021 at lower capacity due to the virus’s effects. Since then, supply and demand have been imbalanced: demand for durable goods surged at a time when suppliers suffered bottlenecks, and now demand has fallen as many suppliers have caught up. Issues with shipping, warehousing, and logistics led to disruptions and delays that reached a peak in late 2021 and early 2022.
For U.S. businesses and consumers, disruptions in the global supply chain trickle down to domestic supply chains as well. As globalization has taken root in recent decades, the U.S. has lost manufacturing capacity. When it became harder to secure goods from elsewhere in the world as a result of the pandemic, businesses and consumers found that American-made alternatives were not easy to find either.
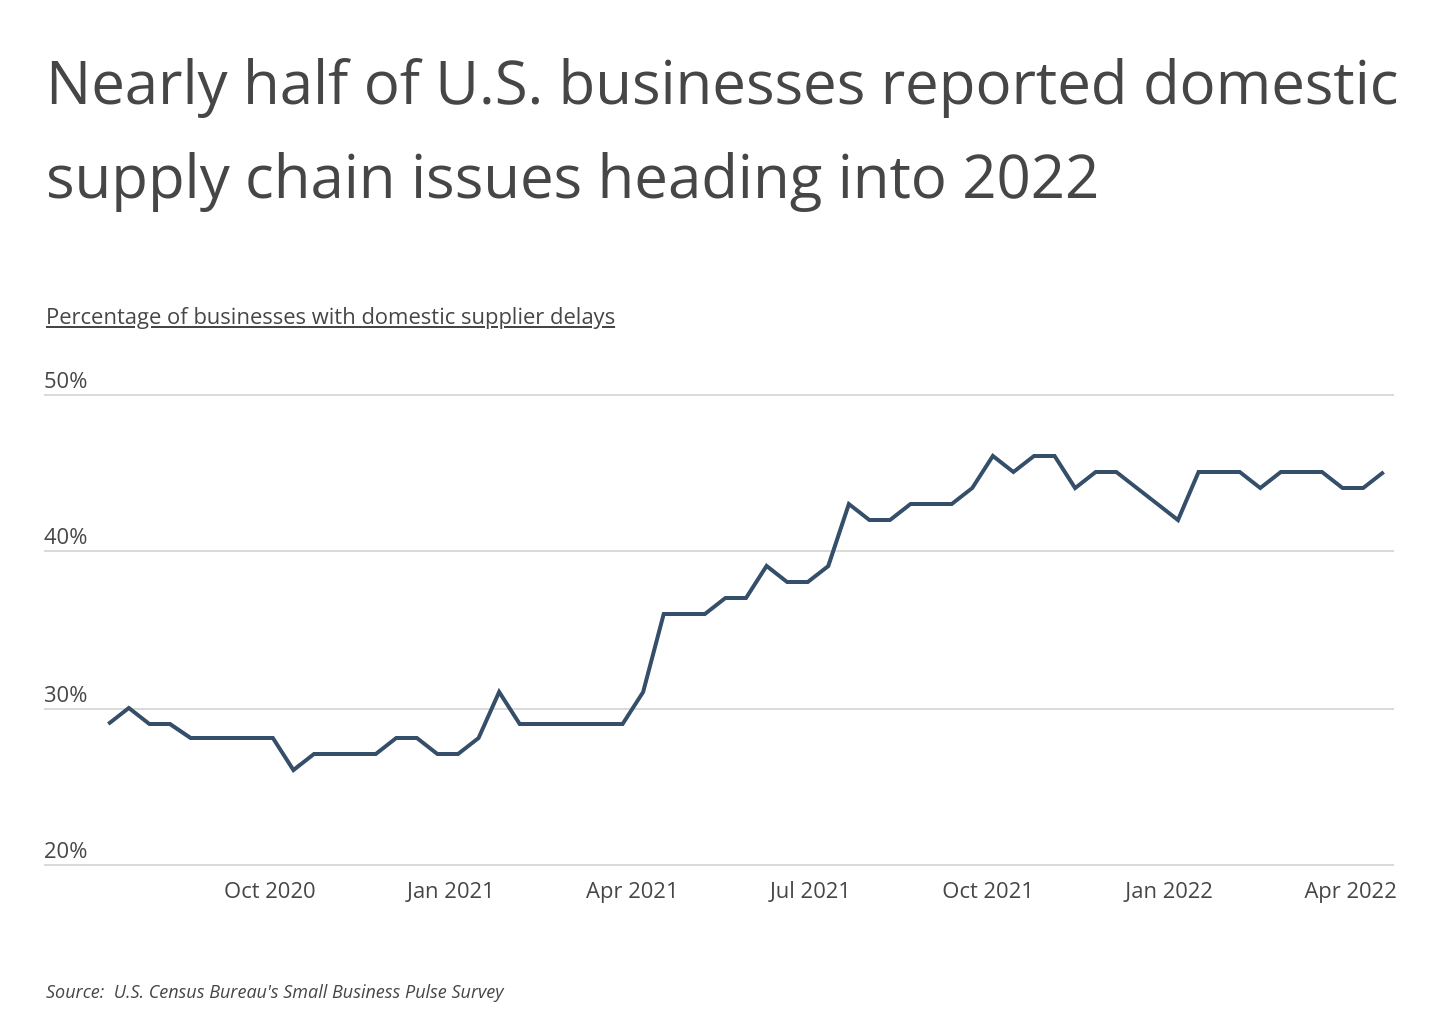
According to data from the U.S. Census Bureau, nearly half of all businesses in the U.S. reported domestic supply chain issues entering 2022. This figure represented significant growth even from earlier periods of the pandemic. For much of late 2020 and early 2021, the share of businesses reporting domestic supply chain issues hovered around 30%. More businesses began to face problems over the summer of 2021, and by fall of 2021, around 45% of businesses were confronting issues with domestic suppliers.
RELATED
Commercial tow truck insurance is a form of insurance for tow trucks that bundles together multiple policies to provide financial protection for businesses that earn money by towing or shipping other vehicles.
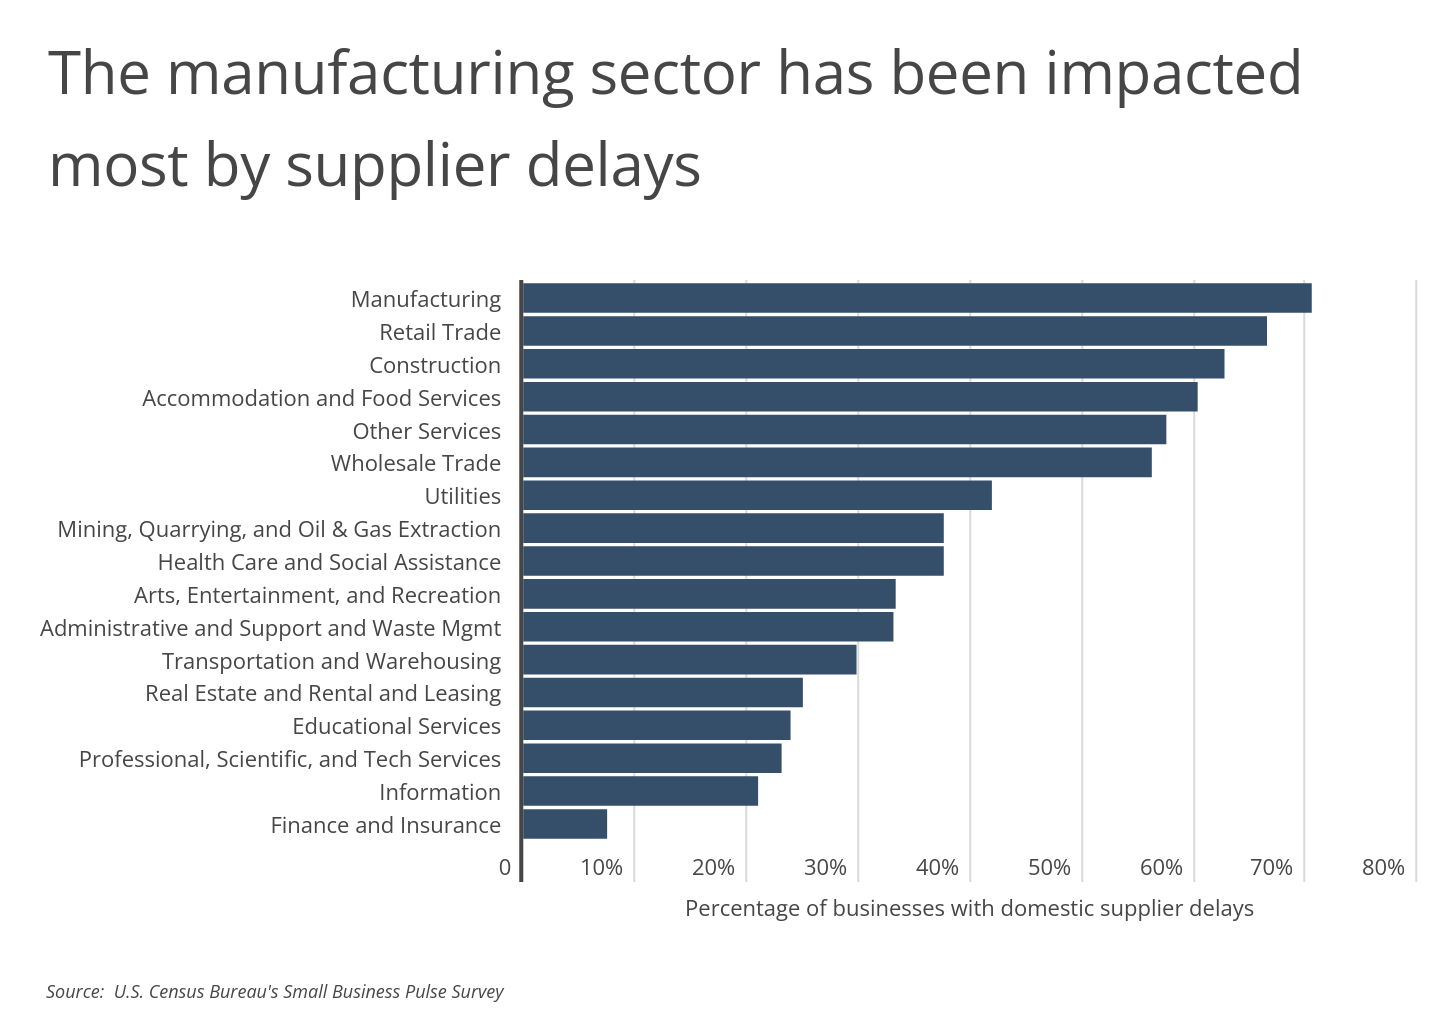
While businesses of all types have run into delays with suppliers, some industries have been hit harder than others. Information-based and service-based businesses generally experienced fewer disruptions, with the finance and insurance industry reporting the least at 7.5%. In contrast, the fields that were most likely to face issues with domestic supplier delays were those who depend heavily on physical goods and materials. Manufacturing led all categories with 70.5% of businesses experiencing supplier delays, while retail trade, construction, and accommodation and food services each had more than 60% of businesses report delays.
Challenges in the domestic supply chain can bring major economic disruptions from the sheer volume of goods shipped within the U.S. Freight businesses move trillions of dollars in goods each year, nearly 90% of which is transported by commercial trucks. For businesses that rely on shipments of parts or materials to create their own products, supply chain delays can make it difficult to provide goods to their own customers. For consumers, breakdowns in the supply chain mean having a harder time finding goods-or paying a premium to purchase them.
RELATED
Business interruption insurance is a valuable investment for businesses that transport goods, as it can safeguard them against unexpected disruptions that may hinder their operations and revenue. This insurance can cover a variety of events, such as severe weather conditions that render it impossible to transport goods, or an extended repair period due to mechanical breakdowns.
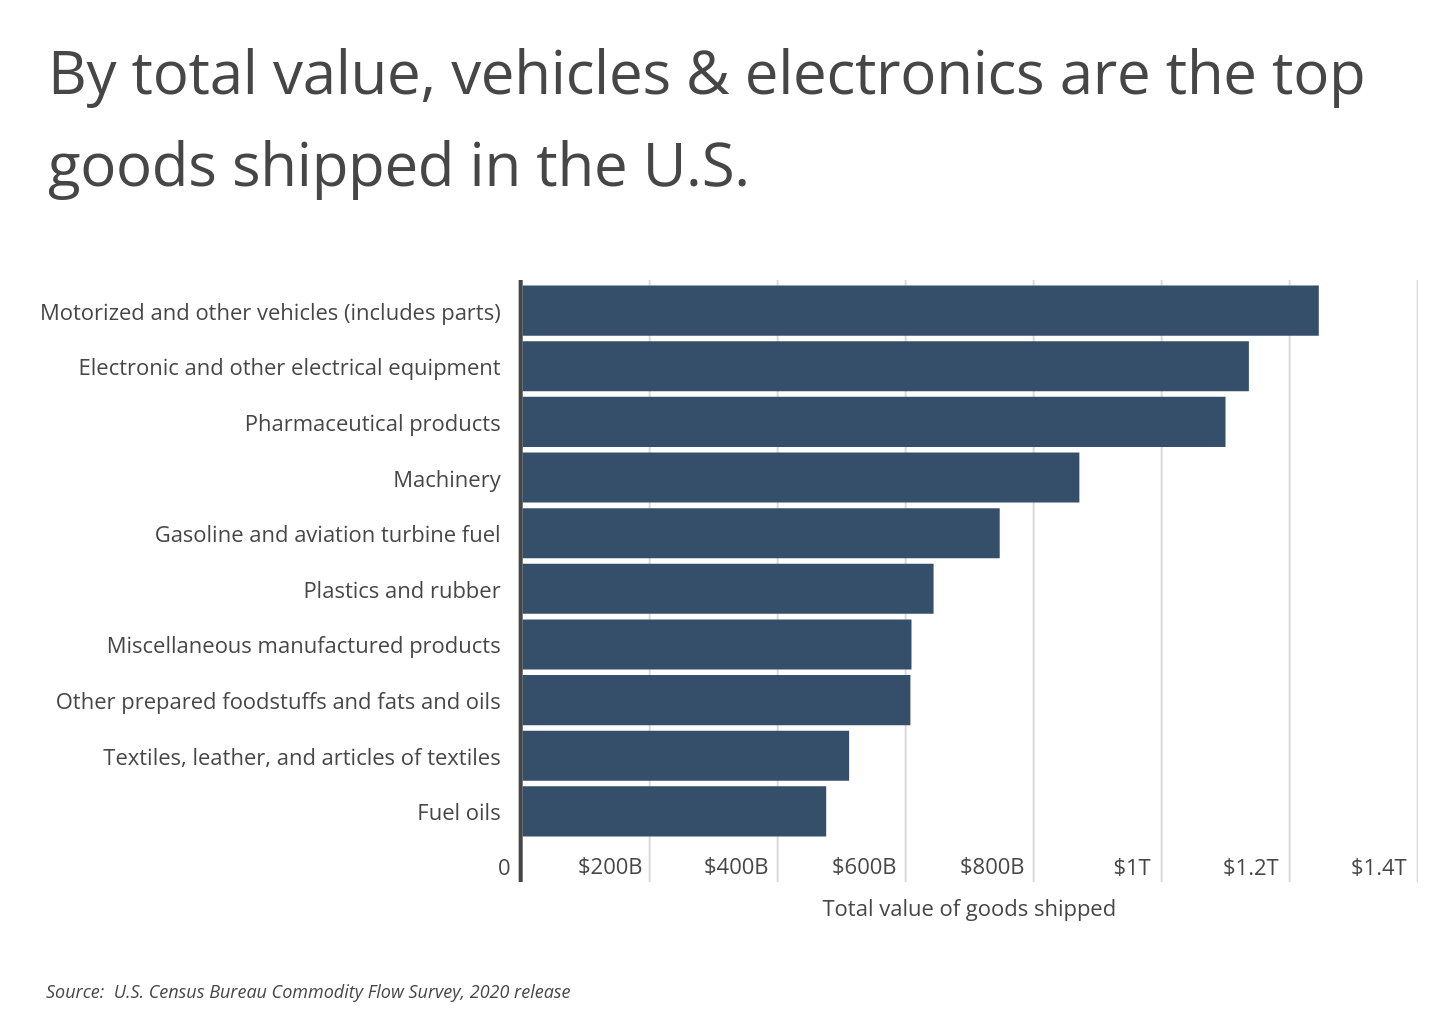
Several of the categories that have faced the most disruption due to supply chain issues are those that make up the highest share of shipped goods. The total annual value of motorized and other vehicles (including parts) shipped in the U.S. is more than $1.2 trillion, with electronic and other electrical equipment registering at $1.1 trillion. Difficulties securing parts like semiconductor chips have affected both of these categories, making products harder to buy and more expensive for consumers.
Within the U.S., certain locations are responsible for a higher volume of goods being shipped. Many of these states are larger in both population and the size of their economies. At the top of the list is California, which is by itself estimated to be the fourth largest economy in the world. With such a high level of economic output, California ships $1.67 trillion in goods-11.5% of the total shipped in the U.S. each year.
The data used in this analysis is from the U.S. Census Bureau’s Commodity Flow Survey, released in 2020. To determine the states that ship the most goods to other states, researchers at Smartest Dollar calculated the total value of goods shipped, the value of goods shipped as a proportion of the U.S. total, and the most common type of goods shipped. States were then ranked according to the total annual value of goods shipped.
Here are the states that ship the most goods to other states.
States That Ship the Most Goods to Other States

Photo Credit: Sean Pavone / Shutterstock
15. Wisconsin
- Total value of goods shipped: $331,625,000,000
- Value of goods shipped as a share of U.S. total: 2.3%
- Most common type of goods shipped: Machinery

Photo Credit: mahaloshine / Shutterstock
14. Washington
- Total value of goods shipped: $374,102,000,000
- Value of goods shipped as a share of U.S. total: 2.6%
- Most common type of goods shipped: Transportation equipment, not elsewhere classified

Photo Credit: Sean Pavone / Shutterstock
13. Tennessee
- Total value of goods shipped: $405,479,000,000
- Value of goods shipped as a share of U.S. total: 2.8%
- Most common type of goods shipped: Motorized and other vehicles (includes parts)

Photo Credit: Agnieszka Gaul / Shutterstock
12. Indiana
- Total value of goods shipped: $438,158,000,000
- Value of goods shipped as a share of U.S. total: 3.0%
- Most common type of goods shipped: Motorized and other vehicles (includes parts)

Photo Credit: Farid Sani / Shutterstock
11. North Carolina
- Total value of goods shipped: $439,152,000,000
- Value of goods shipped as a share of U.S. total: 3.0%
- Most common type of goods shipped: Pharmaceutical products

Photo Credit: gary718 / Shutterstock
10. New Jersey
- Total value of goods shipped: $464,667,000,000
- Value of goods shipped as a share of U.S. total: 3.2%
- Most common type of goods shipped: Electronic and other electrical equipment and components, and office equipment

Photo Credit: f11photo / Shutterstock
9. Georgia
- Total value of goods shipped: $476,321,000,000
- Value of goods shipped as a share of U.S. total: 3.3%
- Most common type of goods shipped: Motorized and other vehicles (includes parts)

Photo Credit: Sean Pavone / Shutterstock
8. Florida
- Total value of goods shipped: $525,179,000,000
- Value of goods shipped as a share of U.S. total: 3.6%
- Most common type of goods shipped: Pharmaceutical products

Photo Credit: Studio Specialty / Shutterstock
7. Michigan
- Total value of goods shipped: $547,720,000,000
- Value of goods shipped as a share of U.S. total: 3.8%
- Most common type of goods shipped: Motorized and other vehicles (includes parts)

Photo Credit: spyarm / Shutterstock
6. New York
- Total value of goods shipped: $590,502,000,000
- Value of goods shipped as a share of U.S. total: 4.1%
- Most common type of goods shipped: Miscellaneous manufactured products

Photo Credit: Zack Frank / Shutterstock
5. Ohio
- Total value of goods shipped: $609,258,000,000
- Value of goods shipped as a share of U.S. total: 4.2%
- Most common type of goods shipped: Motorized and other vehicles (includes parts)

Photo Credit: ESB Professional / Shutterstock
4. Pennsylvania
- Total value of goods shipped: $631,829,000,000
- Value of goods shipped as a share of U.S. total: 4.4%
- Most common type of goods shipped: Pharmaceutical products

Photo Credit: Felix Mizioznikov / Shutterstock
3. Illinois
- Total value of goods shipped: $803,696,000,000
- Value of goods shipped as a share of U.S. total: 5.5%
- Most common type of goods shipped: Pharmaceutical products

Photo Credit: Sean Pavone / Shutterstock
2. Texas
- Total value of goods shipped: $1,635,873,000,000
- Value of goods shipped as a share of U.S. total: 11.3%
- Most common type of goods shipped: Gasoline and aviation turbine fuel

Photo Credit: Sean Pavone / Shutterstock
1. California
- Total value of goods shipped: $1,666,672,000,000
- Value of goods shipped as a share of U.S. total: 11.5%
- Most common type of goods shipped: Electronic and other electrical equipment and components, and office equipment
Detailed Findings & Methodology
The data used in this analysis is from the U.S. Census Bureau’s Commodity Flow Survey, released in 2020. To determine the states that ship the most goods to other states, researchers at Smartest Dollar calculated the total value of goods shipped, the value of goods shipped as a proportion of the U.S. total, and the most common type of goods shipped, which is the commodity(ies) with the greatest annual shipment value. States were then ranked according to the total annual value of goods shipped. The Commodity Flow Survey is the primary source for data on domestic freight shipments. The data includes shipments originating in the U.S.-excluding Puerto Rico and other territories. For a more detailed description of the data source and complete methodology, refer to the Census Bureau.
By clicking the above links, you will go to one of our insurance partners. The specific companies listed above may not be included in our partner's network at this time.