The Most Unionized Industries in the U.S. [2022 Edition]
After decades of declining power and influence, organized labor in the U.S. is making a comeback.
The COVID-19 pandemic has set off a number of shifts in the labor market that have given workers more power. Labor participation rates fell sharply early in the pandemic and still have not recovered to pre-pandemic levels. The Great Resignation saw millions of workers leave their jobs in search of better pay or working conditions. With the labor market still tight, employers have struggled to recruit and retain employees.
In this context, workers have been organizing at rates not seen in decades. One of the most high-profile examples is the union drive at Starbucks stores across the U.S. over the last year. Around 250 Starbucks locations have voted to unionize since the first Starbucks union formed in Buffalo, NY late in 2021. Employees at other major companies have also attempted unionization, including retail and factory workers at Apple and Amazon. And the trend extends to white collar industries like tech, academia, and media, where unionization has historically been limited.
According to the National Labor Relations Board, 1,522 votes on unionization have taken place so far in 2022. This is the highest number of union elections since 2015 and an increase of more than 50% over 2021.
RELATED
Employment practices liability insurance (also known as EPLI insurance) and directors and officers insurance (also known as D&O insurance) provide protection for firms and their officers in the event of employment- or management-related lawsuits.
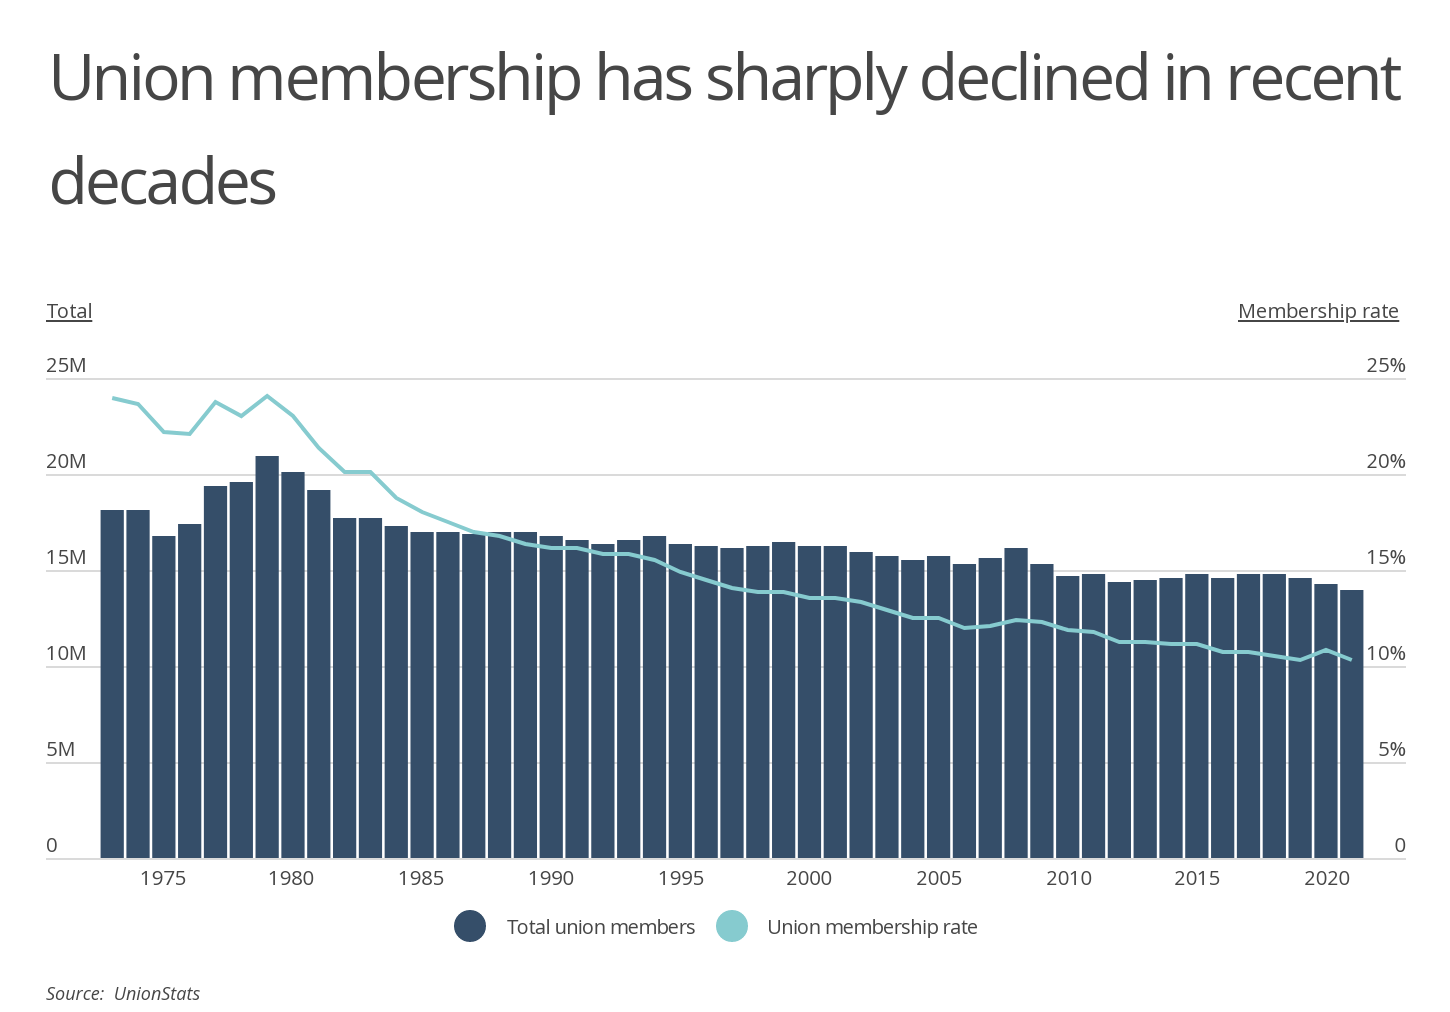
The recent uptick in unionization could begin to reverse a decades-long decline in union membership rates. The peak of union membership over the last 50 years was in 1979, when 24.1% of American workers were union members. That figure has since fallen by more than half, with only 10.3% of workers in a union as of 2021. In raw numbers, there are nearly 7 million fewer union members in the U.S. now than there were in the late 1970s.
Recent trends in unionization are significant to bother workers and employers. Unionization and collective bargaining materially affect the compensation and working conditions that workers experience, for better or for worse. In turn, these factors can affect employers’ ability to staff their businesses and the overhead costs they must pay to operate.
RELATED
Workers who are members of a union often enjoy better benefits than their non-union counterparts. Unions are known for offering solid insurance-such as health, life, and disability insurance-as well as access to retirement benefits, sick leave, and paid time off.
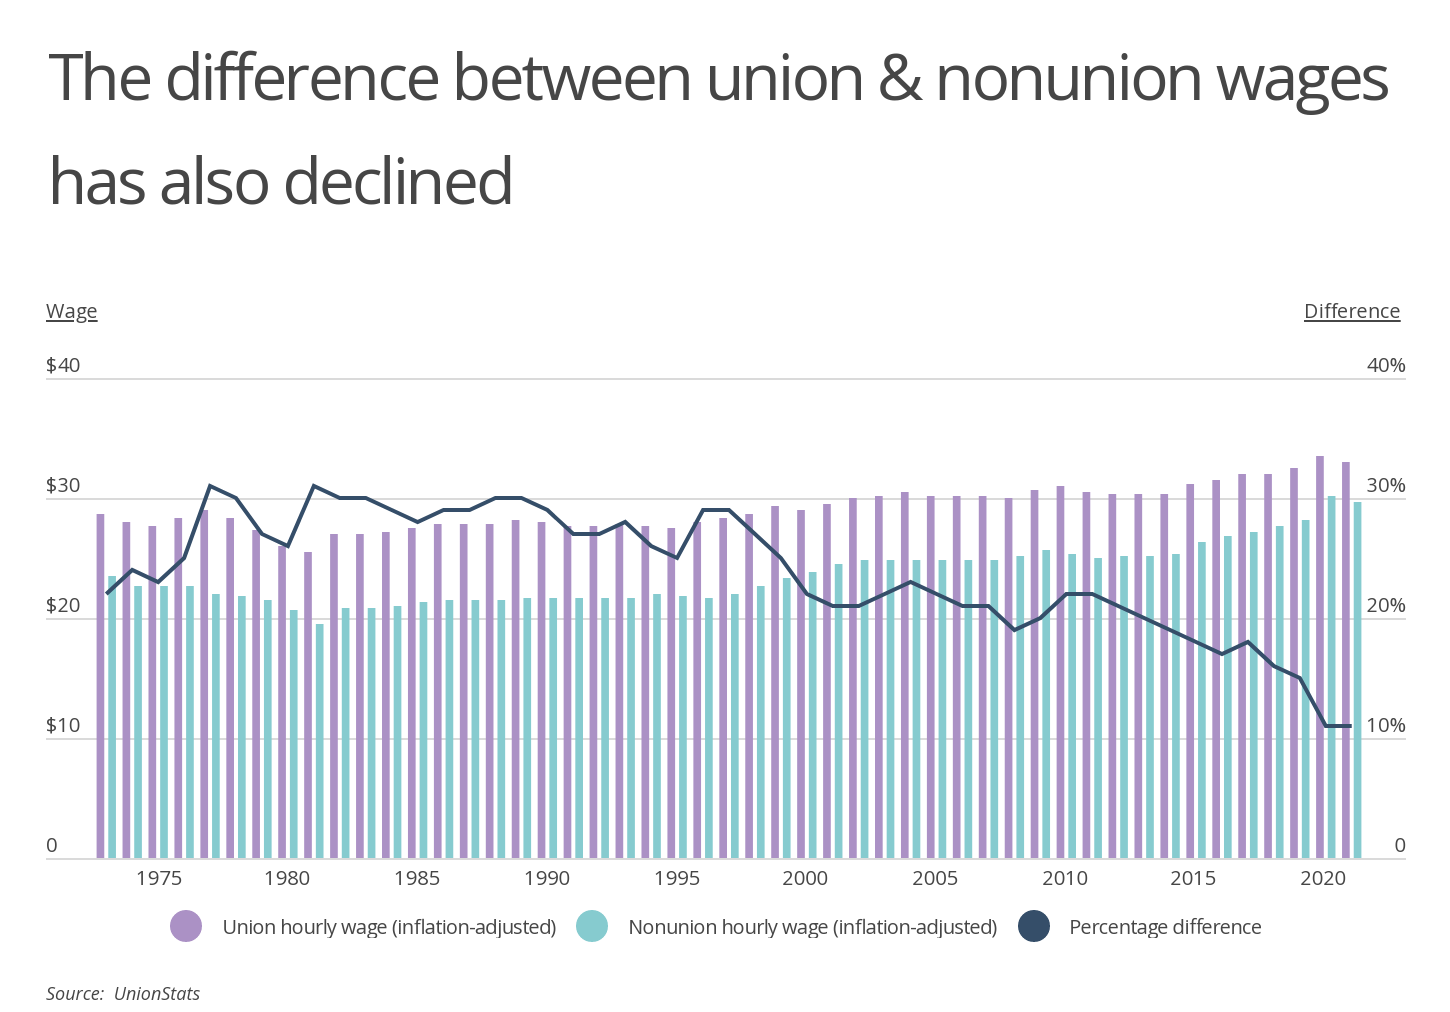
Compensation is one of the most notable differences between unionized and non-unionized workers, as unions are often able to negotiate for higher wages. And as unions’ influence has declined over time, so too has the gap in compensation between union and non-union employee wages. At the height of unionization in the late 1970s and early 1980s, union members made over 30% more per hour than their non-union counterparts. Today, union members continue to earn more than non-union workers, but the gap between the two is just 11%.
The new growth in union membership is unlikely to return the U.S. to historic levels of unionization, and union representation will continue to be stronger in some industries than others. Certain sectors of the economy have significantly higher rates of union membership than others, including transportation, utilities, public administration, and education. At the highest end, some industries have union membership rates greater than 50%.
The data used in this analysis is from Unionstats.com. Researchers at Smartest Dollar calculated the union membership rate for 247 industries, ranking them from highest to lowest. In the event of a tie, the industry with the greater union coverage rate was ranked higher.
Here are the most unionized industries.
Industries With the Highest Union Membership Rates

Photo Credit: Andrey Armyagov / Shutterstock
15. Administration of economic programs and space research
- Union membership rate: 25.0%
- Union coverage rate: 28.1%
- Total union membership: 138,656
- Total union coverage: 156,072
- Sector: Public Administration

Photo Credit: Sergey Nemirovsky / Shutterstock
14. Pulp, paper, and paperboard mills
- Union membership rate: 25.1%
- Union coverage rate: 26.1%
- Total union membership: 47,959
- Total union coverage: 49,928
- Sector: Nondurable Goods Manufacturing

Photo Credit: Viewfoto studio / Shutterstock
13. Administration of environmental quality and housing programs
- Union membership rate: 25.2%
- Union coverage rate: 28.8%
- Total union membership: 76,932
- Total union coverage: 88,138
- Sector: Public Administration

Photo Credit: Zivica Kerkez / Shutterstock
12. Natural gas distribution
- Union membership rate: 25.6%
- Union coverage rate: 25.6%
- Total union membership: 29,094
- Total union coverage: 29,094
- Sector: Utilities

Photo Credit: mavo / Shutterstock
11. Administration of human resource programs
- Union membership rate: 26.2%
- Union coverage rate: 29.5%
- Total union membership: 332,403
- Total union coverage: 373,761
- Sector: Public Administration

Photo Credit: People Image Studio / Shutterstock
10. Sewage treatment facilities
- Union membership rate: 26.4%
- Union coverage rate: 28.0%
- Total union membership: 30,428
- Total union coverage: 32,259
- Sector: Utilities
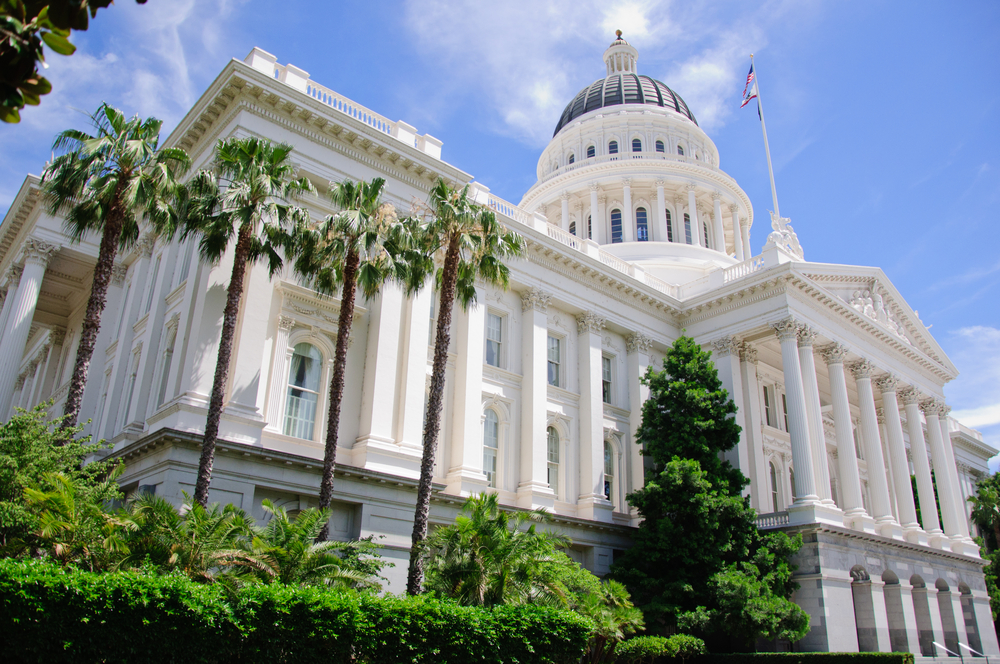
Photo Credit: Feoktistoff / Shutterstock
9. Public finance activities
- Union membership rate: 27.2%
- Union coverage rate: 33.0%
- Total union membership: 90,118
- Total union coverage: 109,429
- Sector: Public Administration
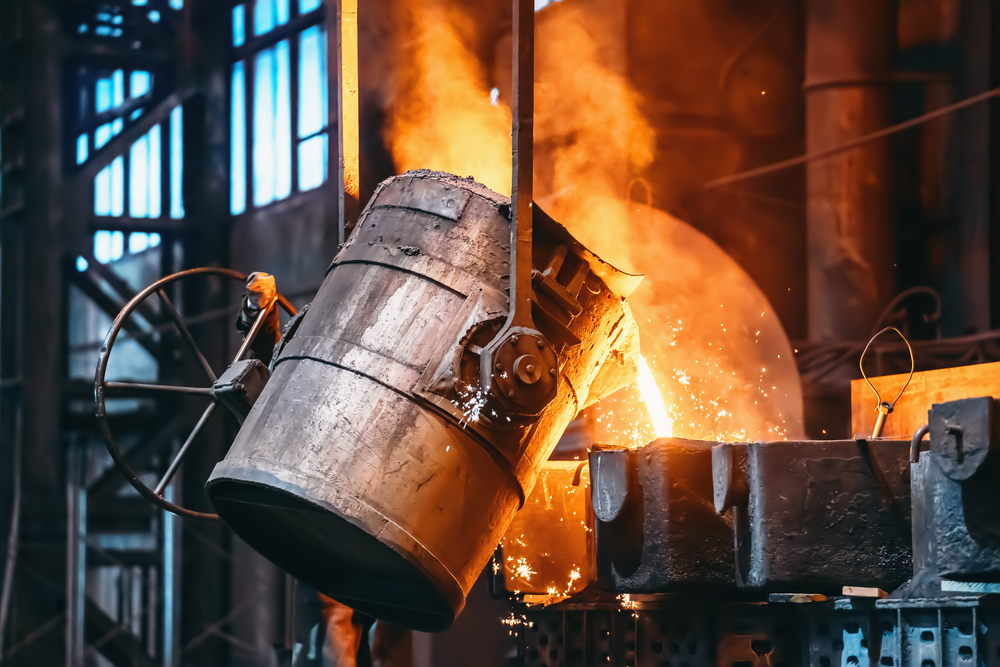
Photo Credit: DedMityay / Shutterstock
8. Foundries
- Union membership rate: 29.5%
- Union coverage rate: 29.5%
- Total union membership: 15,053
- Total union coverage: 15,053
- Sector: Durable Goods Manufacturing

Photo Credit: ersin ergin / Shutterstock
7. Air transportation
- Union membership rate: 38.4%
- Union coverage rate: 40.2%
- Total union membership: 231,414
- Total union coverage: 242,337
- Sector: Transportation & Warehousing

Photo Credit: Ground Picture / Shutterstock
6. Elementary and secondary schools
- Union membership rate: 39.1%
- Union coverage rate: 43.6%
- Total union membership: 3,457,197
- Total union coverage: 3,862,835
- Sector: Educational Services

Photo Credit: LightField Studios / Shutterstock
5. Justice, public order, and safety activities
- Union membership rate: 40.9%
- Union coverage rate: 43.2%
- Total union membership: 1,093,245
- Total union coverage: 1,153,724
- Sector: Public Administration

Photo Credit: LeManna / Shutterstock
4. Bus service and urban transit
- Union membership rate: 42.5%
- Union coverage rate: 43.5%
- Total union membership: 190,016
- Total union coverage: 194,251
- Sector: Transportation & Warehousing
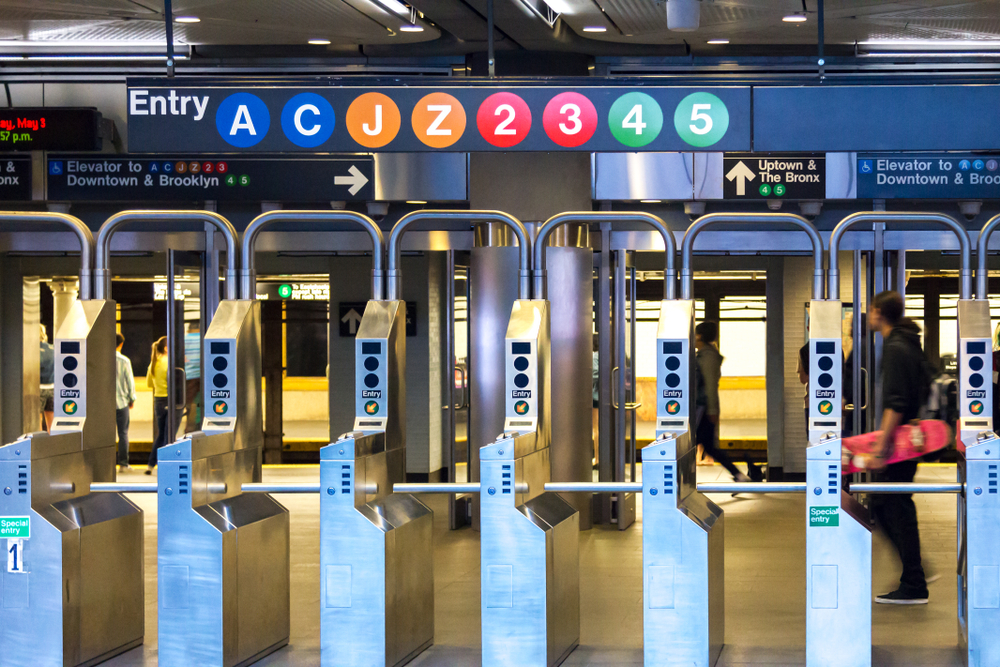
Photo Credit: Ryan DeBerardinis / Shutterstock
3. Rail transportation
- Union membership rate: 54.0%
- Union coverage rate: 56.8%
- Total union membership: 107,632
- Total union coverage: 113,299
- Sector: Transportation & Warehousing

Photo Credit: Drazen Zigic / Shutterstock
2. Postal Service
- Union membership rate: 58.8%
- Union coverage rate: 64.1%
- Total union membership: 369,623
- Total union coverage: 403,417
- Sector: Transportation & Warehousing

Photo Credit: Billion Photos / Shutterstock
1. Labor unions
- Union membership rate: 65.0%
- Union coverage rate: 67.0%
- Total union membership: 52,163
- Total union coverage: 53,821
- Sector: Other Services, Exc. Public Admin.
Detailed Findings & Methodology
The data used in this analysis is from Unionstats.com. Researchers at Smartest Dollar calculated the union membership rate for 247 industries, ranking them from highest to lowest. In the event of a tie, the industry with the greater union coverage rate was ranked higher. Union coverage includes union members as well as employees that are not official members of the union but are covered by union contracts.
By clicking the above links, you will go to one of our insurance partners. The specific companies listed above may not be included in our partner's network at this time.