U.S. Cities With the Most Working Teens [2022 Edition]
Getting a job as a teenager is a rite of passage for some, and a necessity for others. Whatever the reason for employment, a first job is a memorable and often harsh introduction to responsibility, financial independence, and hard lessons-like giving the government a substantial cut of a hard-earned paycheck. However, once the norm, holding a job as a teenager has increasingly become something of the past.
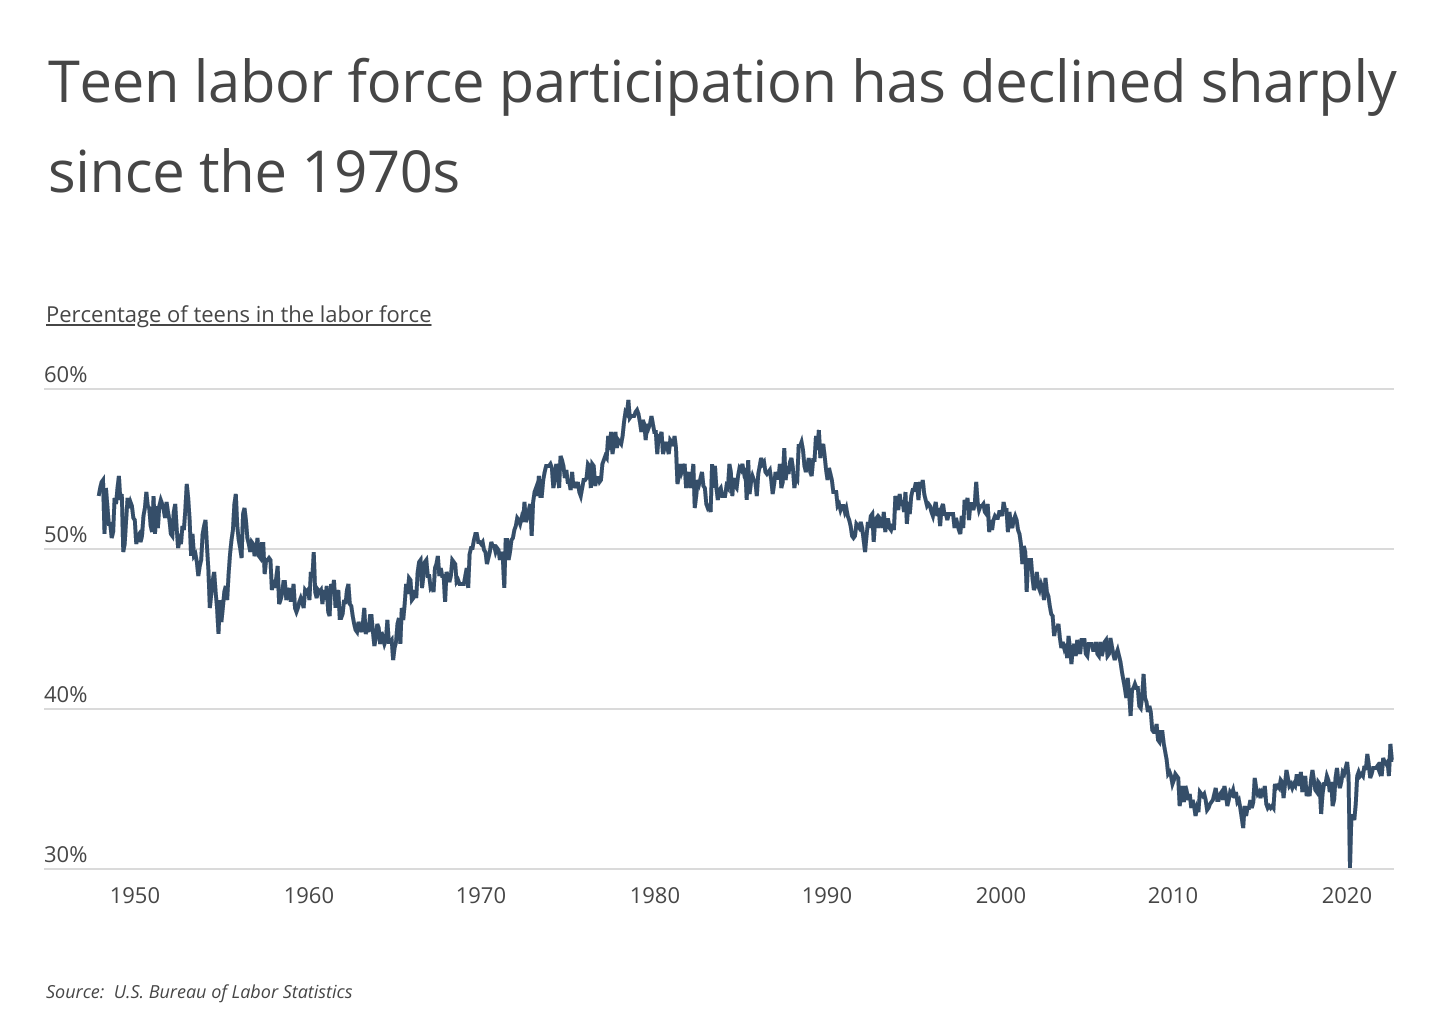
Labor force participation among 16- to 19-year-olds declined sharply since the late 1970s due to a combination of factors, including greater school enrollment rates, higher participation in after-school activities, and an increased emphasis on college preparation. From 1978 through 2011, the national teenage labor force participation rate fell from a peak of 59.3% to 33.3%. While modest gains were made between 2011 and immediately before the COVID-19 pandemic, teen labor force participation remained low when compared to historical levels.
RELATED
Businesses that employ teens can be at a higher risk of litigation due to the unique vulnerabilities and legal protections afforded to young workers. To mitigate these risks, businesses employing teens should make sure to have directors and officers (D&O) insurance. Read our guide to the best D&O insurance companies for more information.
Like many things in the economy, the COVID-19 pandemic appeared to have disrupted this trend. As businesses reopened after mandated shutdowns, teens were attractive employees due to their low rates of high-risk infections, more flexible schedules, and the suspension of in-person after-school activities. Additionally, the departure of older adults from the labor force due to a lack of childcare, health reasons, early retirement, or the expansion of unemployment benefits left a gap in the labor force that teens were able to fill.
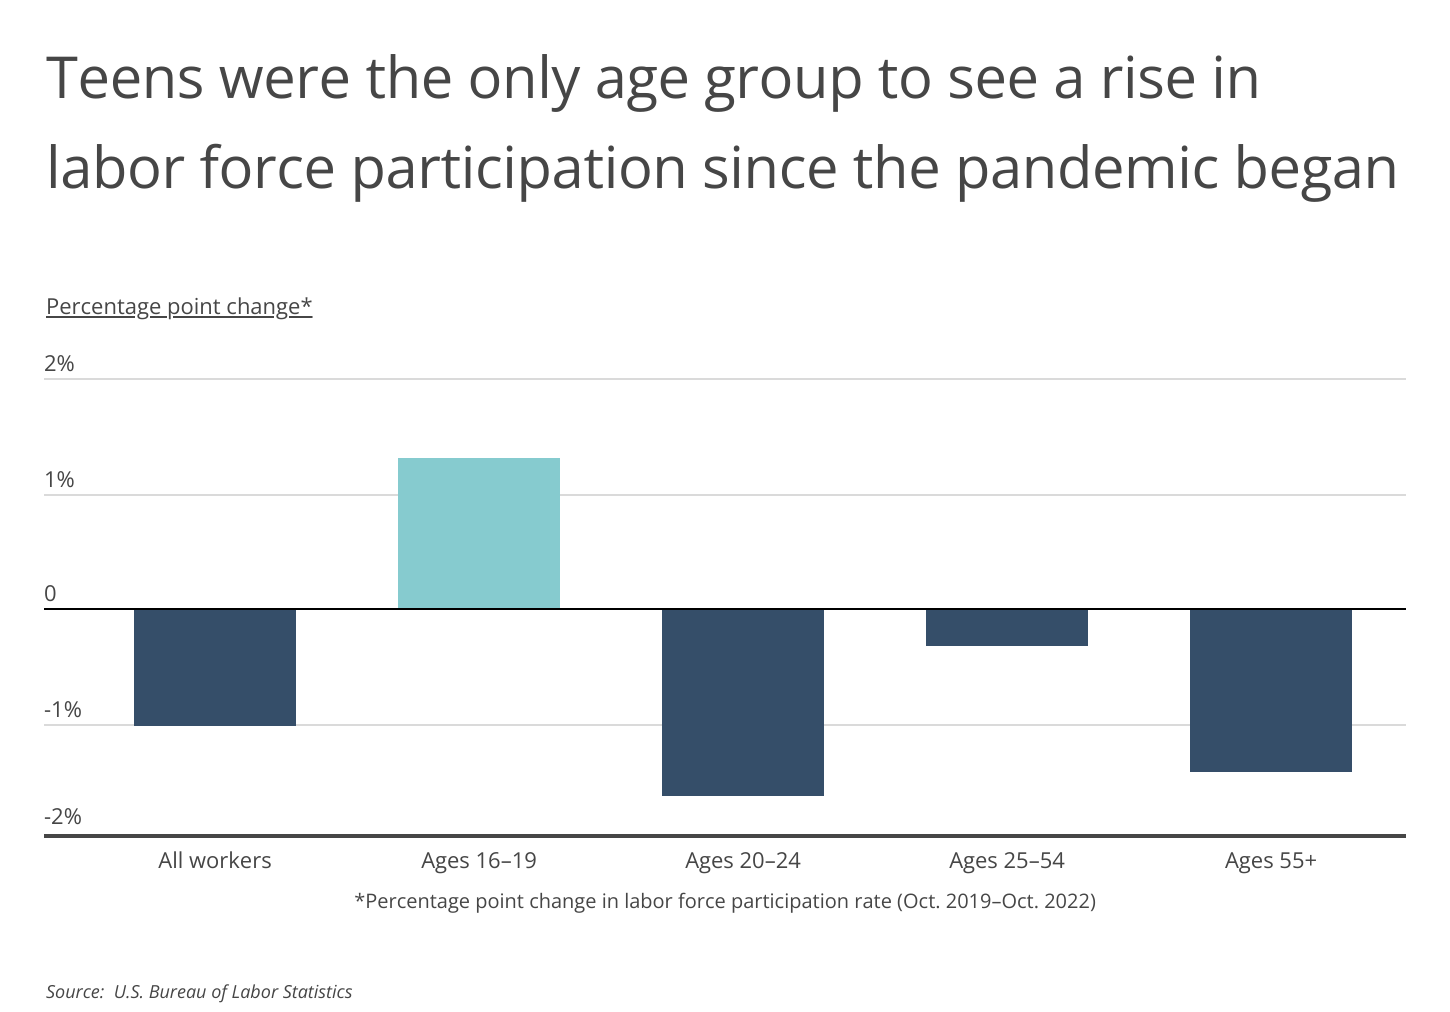
While labor force participation across all workers remains about a percentage point lower today than it was immediately before the pandemic, teen labor force participation is actually up by 1.3 percentage points, according to data from the U.S. Bureau of Labor Statistics. In fact, teens were the only age group to see a rise in labor force participation during the pandemic.
RELATED
Commercial umbrella insurance provides additional liability coverage above and beyond the limits of a company’s underlying insurance policies. This type of insurance can be particularly beneficial for businesses with high-risk operations, those that face significant liability exposures, or those with high asset values.
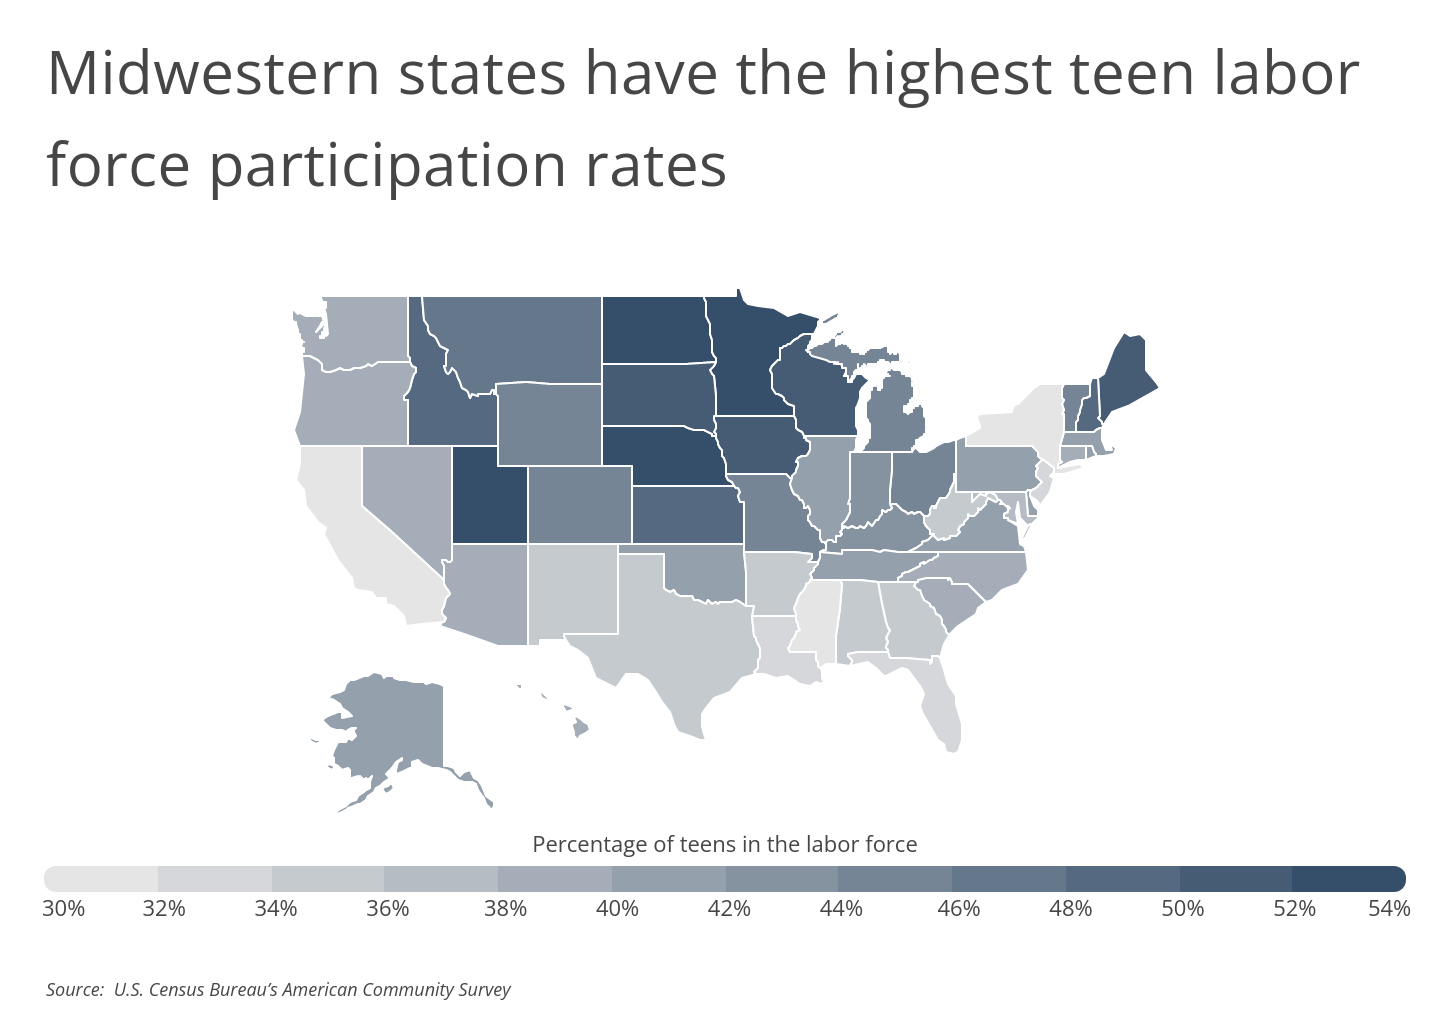
While U.S. teenagers are working at higher rates overall than before the pandemic, the number of working teens varies widely by location. For example, teen labor force participation rates currently exceed 50% in Midwestern states like North and South Dakota, Nebraska, Minnesota, Wisconsin, and Iowa. Utah (53.1%) and Maine (50.9%) also report high teenage labor force participation rates. At the opposite end of the spectrum, states in the Sun Belt region and on the coasts report rates below 40%.
These differences are due to a number of cultural, demographic, and economic factors. For instance, the Midwest has a long history of teens working in agricultural settings. Different racial and ethnic groups show large variation in teen labor force participation. Higher minimum wages are believed to negatively impact the number of teens who are able to secure employment. More recently, differences in COVID-19 policy and responses had major impacts on local labor market conditions, which ultimately affected teen workers differently across states.
The data referenced below is from the U.S. Census Bureau. To determine the locations with the most working teens, researchers at Smartest Dollar calculated the percentage of teens in the labor force. In the event of a tie, the location with the greater total number of teens in the labor force was ranked higher. For school enrollment, teens were defined as those between ages 15–19, but for labor force participation, teens were defined as those between ages 16–19.
Here are the U.S. metropolitan areas with the most working teens.
Large Metros With the Most Working Teens

Photo Credit: Richard Cavalleri / Shutterstock
15. Providence-Warwick, RI-MA
- Teens in the labor force: 43.0%
- Teens enrolled in school: 90.1%
- Teens not in school and not in the labor force: 3.2%
- Median household income: $70,676

Photo Credit: Richard Cavalleri / Shutterstock
14. Buffalo-Cheektowaga, NY
- Teens in the labor force: 43.5%
- Teens enrolled in school: 89.6%
- Teens not in school and not in the labor force: 4.2%
- Median household income: $59,079

Photo Credit: Alexandr Junek Imaging / Shutterstock
13. Virginia Beach-Norfolk-Newport News, VA-NC
- Teens in the labor force: 44.6%
- Teens enrolled in school: 84.1%
- Teens not in school and not in the labor force: 3.6%
- Median household income: $68,454

Photo Credit: Agnieszka Gaul / Shutterstock
12. Columbus, OH
- Teens in the labor force: 44.9%
- Teens enrolled in school: 89.4%
- Teens not in school and not in the labor force: 3.9%
- Median household income: $66,715

Photo Credit: Sean Pavone / Shutterstock
11. Nashville-Davidson–Murfreesboro–Franklin, TN
- Teens in the labor force: 45.3%
- Teens enrolled in school: 88.3%
- Teens not in school and not in the labor force: 3.6%
- Median household income: $68,406

Photo Credit: Agnieszka Gaul / Shutterstock
10. Cincinnati, OH-KY-IN
- Teens in the labor force: 45.7%
- Teens enrolled in school: 87.7%
- Teens not in school and not in the labor force: 4.1%
- Median household income: $66,435

Photo Credit: Sean Pavone / Shutterstock
9. St. Louis, MO-IL
- Teens in the labor force: 45.9%
- Teens enrolled in school: 88.5%
- Teens not in school and not in the labor force: 4.2%
- Median household income: $65,725

Photo Credit: Andrew Zarivny / Shutterstock
8. Denver-Aurora-Lakewood, CO
- Teens in the labor force: 46.3%
- Teens enrolled in school: 86.7%
- Teens not in school and not in the labor force: 4.3%
- Median household income: $83,289

Photo Credit: Sean Pavone / Shutterstock
7. Cleveland-Elyria, OH
- Teens in the labor force: 47.1%
- Teens enrolled in school: 88.0%
- Teens not in school and not in the labor force: 4.2%
- Median household income: $57,263

Photo Credit: Harold Stiver / Shutterstock
6. Louisville/Jefferson County, KY-IN
- Teens in the labor force: 47.2%
- Teens enrolled in school: 85.4%
- Teens not in school and not in the labor force: 4.7%
- Median household income: $60,891

Photo Credit: Paul Brady Photography / Shutterstock
5. Milwaukee-Waukesha, WI
- Teens in the labor force: 47.9%
- Teens enrolled in school: 89.1%
- Teens not in school and not in the labor force: 4.4%
- Median household income: $63,739

Photo Credit: Sean Pavone / Shutterstock
4. Kansas City, MO-KS
- Teens in the labor force: 48.6%
- Teens enrolled in school: 87.7%
- Teens not in school and not in the labor force: 3.9%
- Median household income: $69,240

Photo Credit: photo.ua / Shutterstock
3. Minneapolis-St. Paul-Bloomington, MN-WI
- Teens in the labor force: 49.8%
- Teens enrolled in school: 91.2%
- Teens not in school and not in the labor force: 3.3%
- Median household income: $82,887

Photo Credit: Henryk Sadura / Shutterstock
2. Grand Rapids-Kentwood, MI
- Teens in the labor force: 50.1%
- Teens enrolled in school: 87.6%
- Teens not in school and not in the labor force: 3.8%
- Median household income: $66,297

Photo Credit: photo.ua / Shutterstock
1. Salt Lake City, UT
- Teens in the labor force: 50.2%
- Teens enrolled in school: 85.1%
- Teens not in school and not in the labor force: 5.0%
- Median household income: $77,102
Detailed Findings & Methodology
The data used in this analysis is from the U.S. Census Bureau’s 2021 American Community Survey. To determine the locations with the most working teens, researchers at Smartest Dollar calculated the percentage of teens in the labor force. In the event of a tie, the location with the greater total number of teens in the labor force was ranked higher. Note, for school enrollment teens were defined as those between age 15 and 19. For labor force participation, teens were defined as those between age 16 and 19. To improve relevance, only metropolitan areas with at least 100,000 residents were included. Additionally, metros were grouped into cohorts based on population size: small (100,000–349,999), midsize (350,000–999,999), and large (1,000,000 or more).
By clicking the above links, you will go to one of our insurance partners. The specific companies listed above may not be included in our partner's network at this time.