U.S. Industries Where the Most Workers Are Quitting Their Jobs [2021 Edition]
More than a year and a half into the COVID-19 pandemic, one of the most noteworthy economic stories has been what economic commentators have termed “The Great Resignation.” Recent data from the U.S. Bureau of Labor Statistics found that 4.3 million Americans quit their jobs in August 2021, representing approximately 2.9% of the total workforce. The August numbers were the highest ever reported by the BLS.
The Great Resignation is creating immediate challenges for employers seeking to fill positions but could also be setting the stage for long-term changes in the economy that benefit workers. Many workers are reconsidering their values when it comes to work and seeking out positions that better match their preferences. In efforts to fill positions and retain current employees, many employers have been responding by increasing pay and benefits and offering more flexible work arrangements.
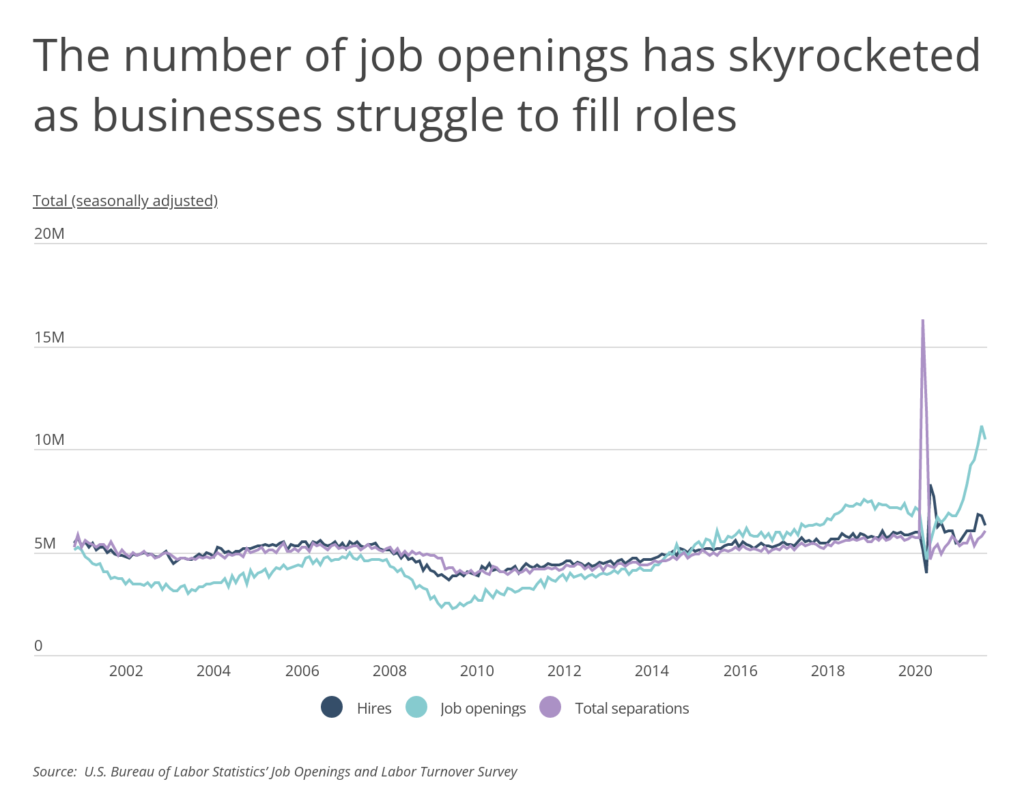
This dynamic has changed dramatically over the course of the pandemic. In the spring and summer of 2020, businesses that were unable to open or operate at full capacity due to shutdowns and other restrictions laid off employees en masse or drastically cut their hours. A total of 16.3 million job separations took place in March 2020 with an additional 11.7 million in April, and the U.S. unemployment rate peaked near 15% last spring. But as the economy has reopened over time, employers have found themselves in need of workers. The number of job openings increased to more than 10 million per month this summer, but hiring has lagged behind at around 6 million hires per month.
FOR EMPLOYERS
One of the most important types of small business insurance for companies that provide professional services, advice, or recommendations is professional liability insurance. The best professional liability insurance companies provide legal protection in the event that someone pursues a lawsuit relating to an error made by your business.
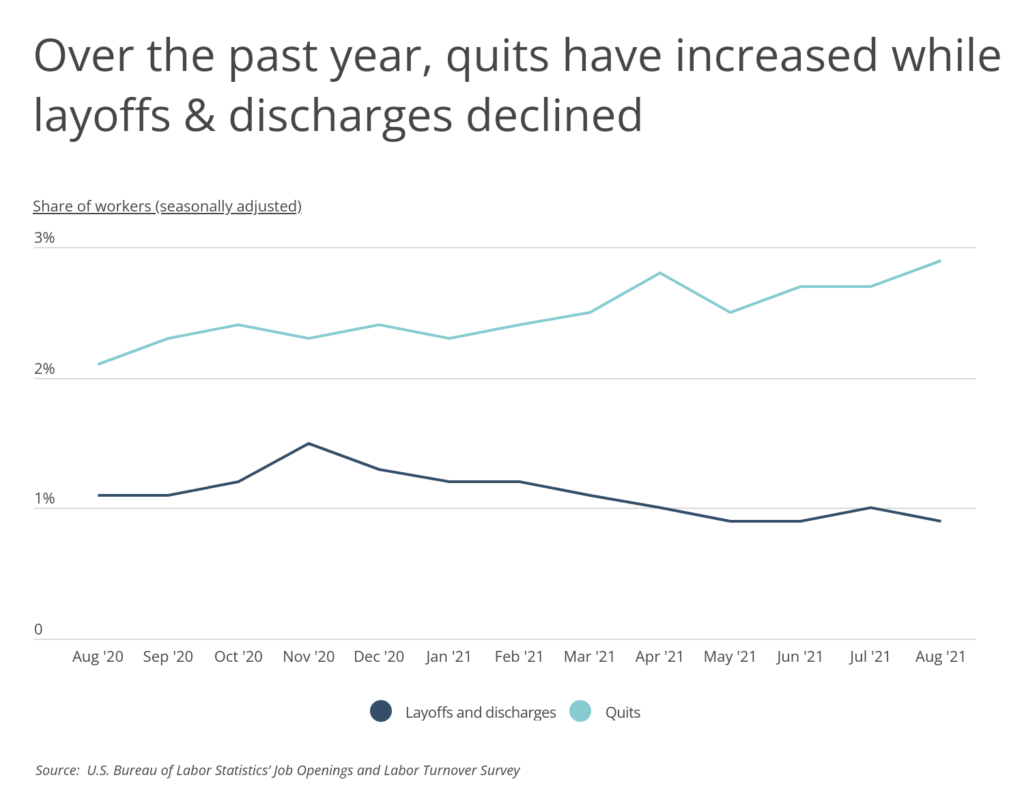
As a result of these shifting conditions, trends in job separations have changed over the last year. Layoffs and discharges have shown a slight downward trend, with 1.1% of workers being laid off in August of 2020, compared to 0.9% in August 2021. Over the same time period, the share of quits rose from 2.1% to 2.9%.
Economic experts have offered a number of reasons why employers have had a difficult time filling positions and keeping workers in place. Generous unemployment benefits and other supports like a federal eviction moratorium gave unemployed workers a financial safety net through most of the pandemic, though these measures began to wind down over the summer. Many Baby Boomers who lost their jobs during the pandemic or were nearing the end of their working years have transitioned into retirement. Continued concern about the spread of COVID-19 has remained a barrier for many workers, especially when a wave of cases from the Delta variant emerged this summer. Challenges facing the child care industry have made it more difficult for parents to make arrangements for their children while they work.
But the simplest explanation may be compensation and working conditions. Most of the professions where workers are quitting their jobs in the greatest numbers-and where employers are struggling the most to fill positions-have been lower-wage occupations, like food service and retail, or where people have faced greater exposure to the coronavirus, like health care and manufacturing. Even in better-paying fields like professional and business services, the pandemic has caused workers to reevaluate their preferences and seek out greater flexibility in when and where they work.
To determine the industries where most people are quitting their jobs, researchers at Smartest Dollar looked at the seasonally adjusted quit rate for August 2021 using data from the U.S. Bureau of Labor Statistics. In the event of a tie, the industry with the greater number of total quits was ranked higher.
Here are the industries where the most workers are quitting their jobs.
Industries With the Highest Quit Rates

Photo Credit: Monkey Business Images / Shutterstock
10. Transportation, warehousing, and utilities
- Share of workers who quit their job: 2.3%
- Total workers who quit their job: 148,000
- Percentage point change in quit rate (YoY): +0.1
- Share of workers who were laid off or discharged: 0.9%
- Total workers who were laid off or fired: 58,000
- Percentage point change in layoff or discharge rate (YoY): -0.6
FOR EMPLOYERS
Offering a competitive benefits package, including health insurance, retirement plan, and life insurance, will help protect your workers and improve retention.

Photo Credit: Byjeng / Shutterstock
9. Other services
- Share of workers who quit their job: 2.4%
- Total workers who quit their job: 136,000
- Percentage point change in quit rate (YoY): +1.3
- Share of workers who were laid off or discharged: 0.5%
- Total workers who were laid off or fired: 27,000
- Percentage point change in layoff or discharge rate (YoY): +0.2

Photo Credit: iJeab / Shutterstock
8. Wholesale trade
- Share of workers who quit their job: 2.7%
- Total workers who quit their job: 155,000
- Percentage point change in quit rate (YoY): +1.1
- Share of workers who were laid off or discharged: 0.6%
- Total workers who were laid off or fired: 33,000
- Percentage point change in layoff or discharge rate (YoY): -0.5

Photo Credit: Sorn340 Studio Images / Shutterstock
7. Construction
- Share of workers who quit their job: 2.7%
- Total workers who quit their job: 199,000
- Percentage point change in quit rate (YoY): +1.4
- Share of workers who were laid off or discharged: 2.1%
- Total workers who were laid off or fired: 159,000
- Percentage point change in layoff or discharge rate (YoY): -0.7

Photo Credit: Dmytro Zinkevych / Shutterstock
6. Health care and social assistance
- Share of workers who quit their job: 2.7%
- Total workers who quit their job: 534,000
- Percentage point change in quit rate (YoY): +0.6
- Share of workers who were laid off or discharged: 0.4%
- Total workers who were laid off or fired: 78,000
- Percentage point change in layoff or discharge rate (YoY): -0.4

Photo Credit: Aleksander Krsmanovic / Shutterstock
5. Nondurable goods manufacturing
- Share of workers who quit their job: 3.0%
- Total workers who quit their job: 141,000
- Percentage point change in quit rate (YoY): +0.8
- Share of workers who were laid off or discharged: 0.9%
- Total workers who were laid off or fired: 44,000
- Percentage point change in layoff or discharge rate (YoY): -0.1

Photo Credit: Monkey Business Images / Shutterstock
4. Professional and business services
- Share of workers who quit their job: 3.4%
- Total workers who quit their job: 706,000
- Percentage point change in quit rate (YoY): +0.7
- Share of workers who were laid off or discharged: 1.7%
- Total workers who were laid off or fired: 348,000
- Percentage point change in layoff or discharge rate (YoY): -0.2

Photo Credit: Nejron Photo / Shutterstock
3. Arts, entertainment, and recreation
- Share of workers who quit their job: 3.7%
- Total workers who quit their job: 79,000
- Percentage point change in quit rate (YoY): +3.0
- Share of workers who were laid off or discharged: 2.1%
- Total workers who were laid off or fired: 44,000
- Percentage point change in layoff or discharge rate (YoY): +0.2

Photo Credit: George Rudy / Shutterstock
2. Retail trade
- Share of workers who quit their job: 4.7%
- Total workers who quit their job: 721,000
- Percentage point change in quit rate (YoY): +1.3
- Share of workers who were laid off or discharged: 1.2%
- Total workers who were laid off or fired: 187,000
- Percentage point change in layoff or discharge rate (YoY): 0.0

Photo Credit: Kamil Macniak / Shutterstock
1. Accommodation and food services
- Share of workers who quit their job: 6.8%
- Total workers who quit their job: 892,000
- Percentage point change in quit rate (YoY): +2.5
- Share of workers who were laid off or discharged: 1.2%
- Total workers who were laid off or fired: 155,000
- Percentage point change in layoff or discharge rate (YoY): -0.2
Methodology & Detailed Findings
The data used in this analysis is from the U.S. Bureau of Labor Statistics’ Job Openings and Labor Turnover Survey for the month of August 2021. All statistics shown are seasonally adjusted. To determine the industries where most people are quitting their jobs, researchers looked at the seasonally adjusted quit rate for August 2021. In the event of a tie, the industry with the greater number of total quits was ranked higher.
By clicking the above links, you will go to one of our insurance partners. The specific companies listed above may not be included in our partner's network at this time.