U.S. Cities Where Residents Are Unable to Quarantine
The COVID-19 pandemic has caused Americans to reassess their living arrangements, work situations, how they travel, and how they spend their free time. It has also impacted how they manage at home when faced with a COVID-19 infection or exposure in order to keep others safe.
The Centers for Disease Control (CDC) recommends that people infected with COVID-19 self-isolate at home and stay in a specific “sick room” and use a separate bathroom if possible. However, many American households do not have enough rooms or amenities to quarantine effectively. According to data from the U.S. Census Bureau, it is estimated that at least 11.5 million households, or 13.1% of multi-person households, are unable to effectively quarantine due to not having enough bedrooms, a full kitchen, or complete plumbing in their homes.
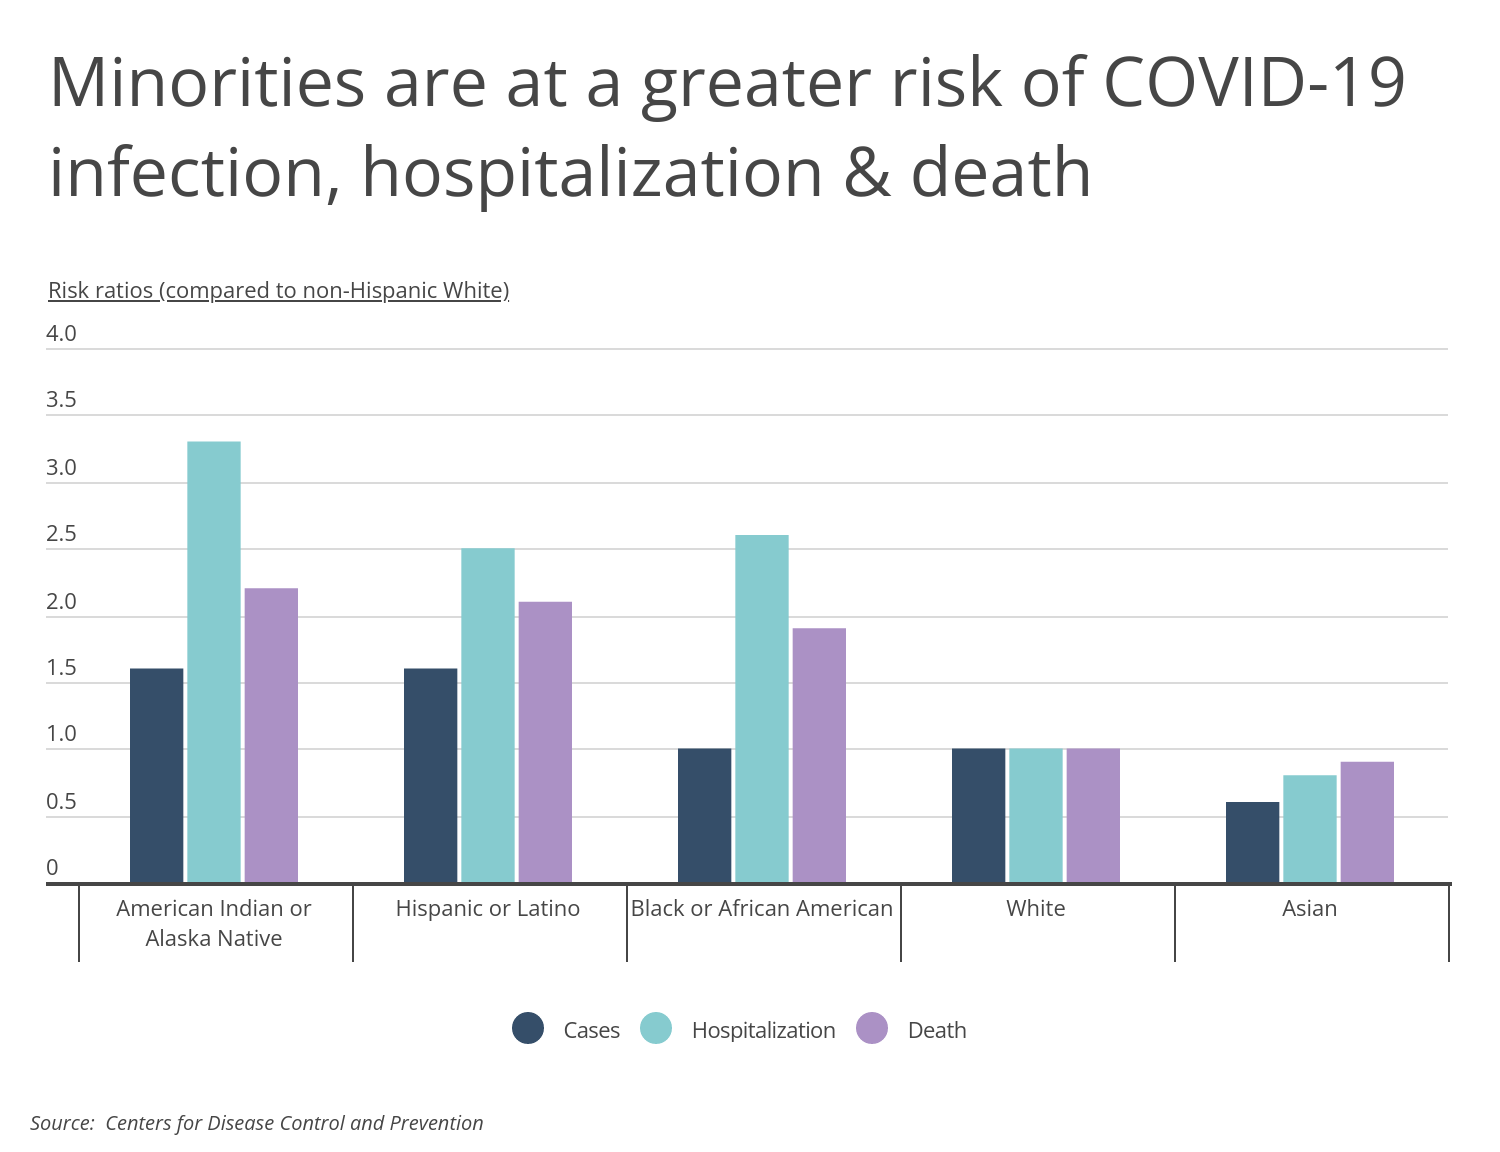
CDC data shows that minorities are at increased risk of COVID-19 infection, hospitalization, and death when compared to non-Hispanic Whites. This is due to a number of factors, including the increased prevalence of certain underlying health conditions among minorities, unequal access to health care, and increased exposure to the virus due to occupation. American Indian or Alaska Natives are at particularly high risk of both COVID-19 infections and adverse outcomes. In comparison to non-Hispanic Whites, they are 1.6 times as likely to become infected with COVID-19, 3.3 times as likely to be hospitalized, and 2.2 times as likely to die. Other minorities, especially Hispanics and Blacks, are also at a much greater risk of infection, hospitalization, and death.

FOR BUSINESS OWNERS
COVID-19 has created new challenges for both workers and business owners, which is why it’s important to make sure you have the right insurance. Our recently updated small business insurance guide has all the information you need.
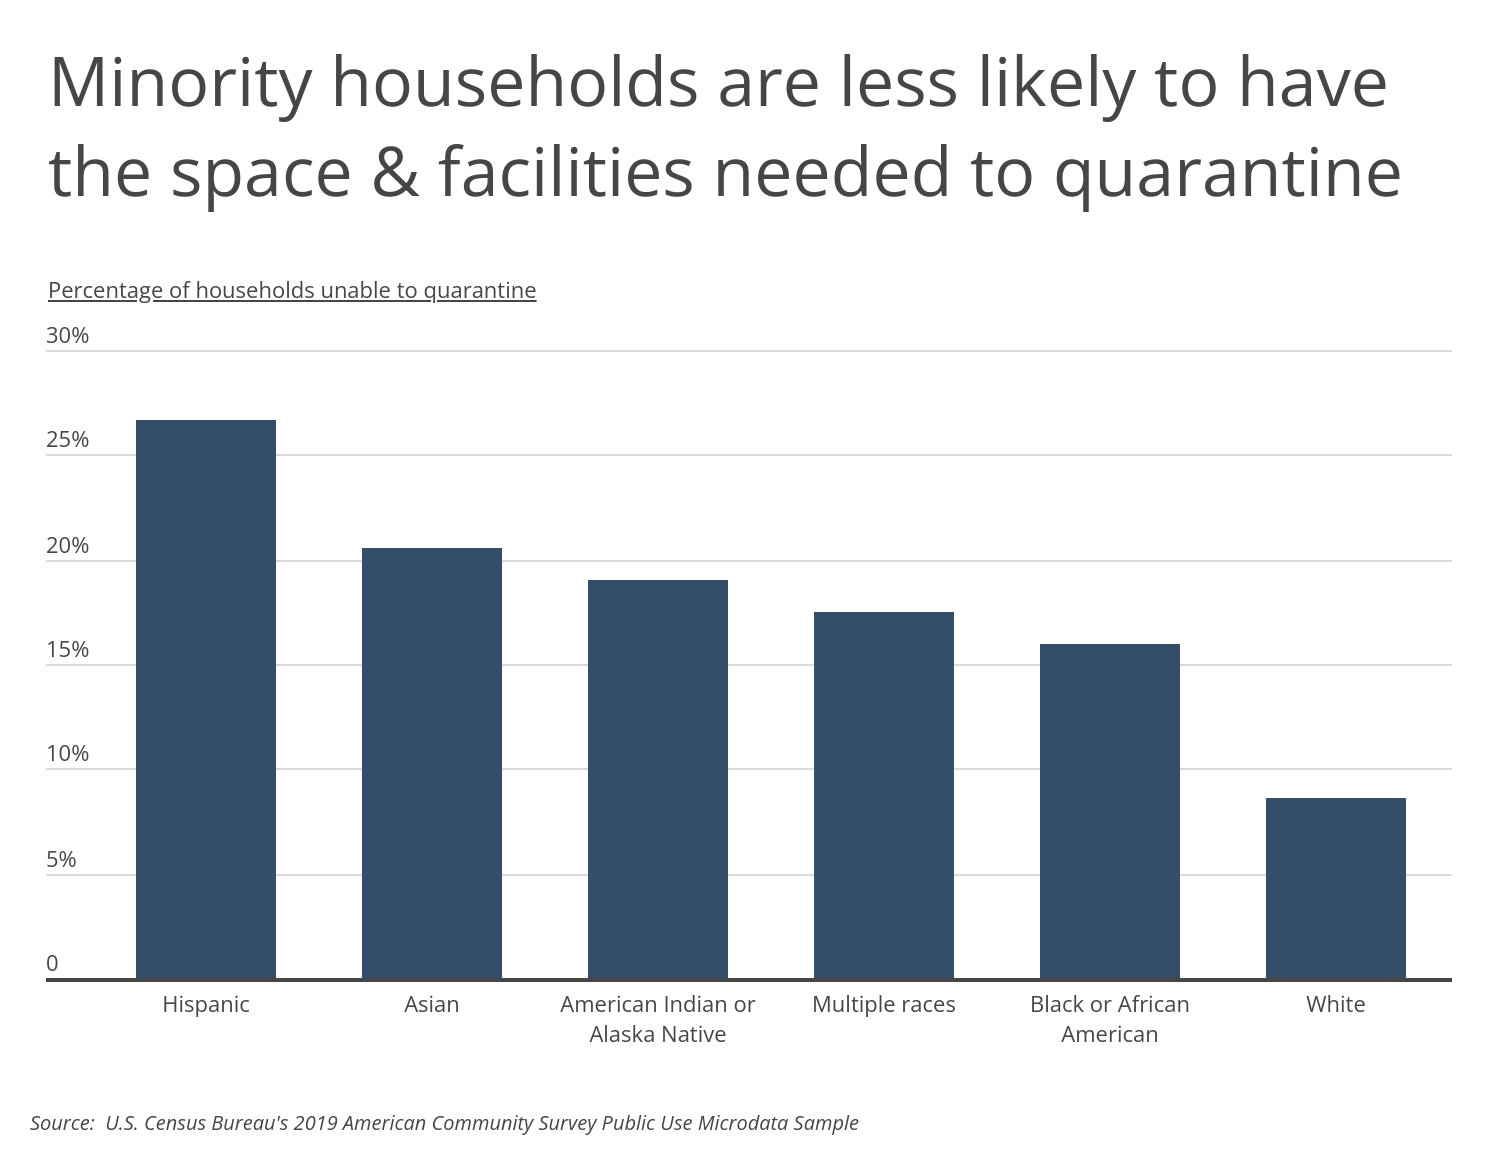
Not only are minority households at greater risk of COVID-19 infection and adverse outcomes, but they are also less likely than non-Hispanic White households to be able to quarantine effectively when considering the availability of separate bedrooms, the presence of a full kitchen, and complete plumbing. Over one in four Hispanic households are unable to quarantine effectively due to their living arrangement; similarly high rates are observed in other non-White communities. In contrast, less than one out of every 10 non-Hispanic White households lack the basic necessities to quarantine an individual effectively.

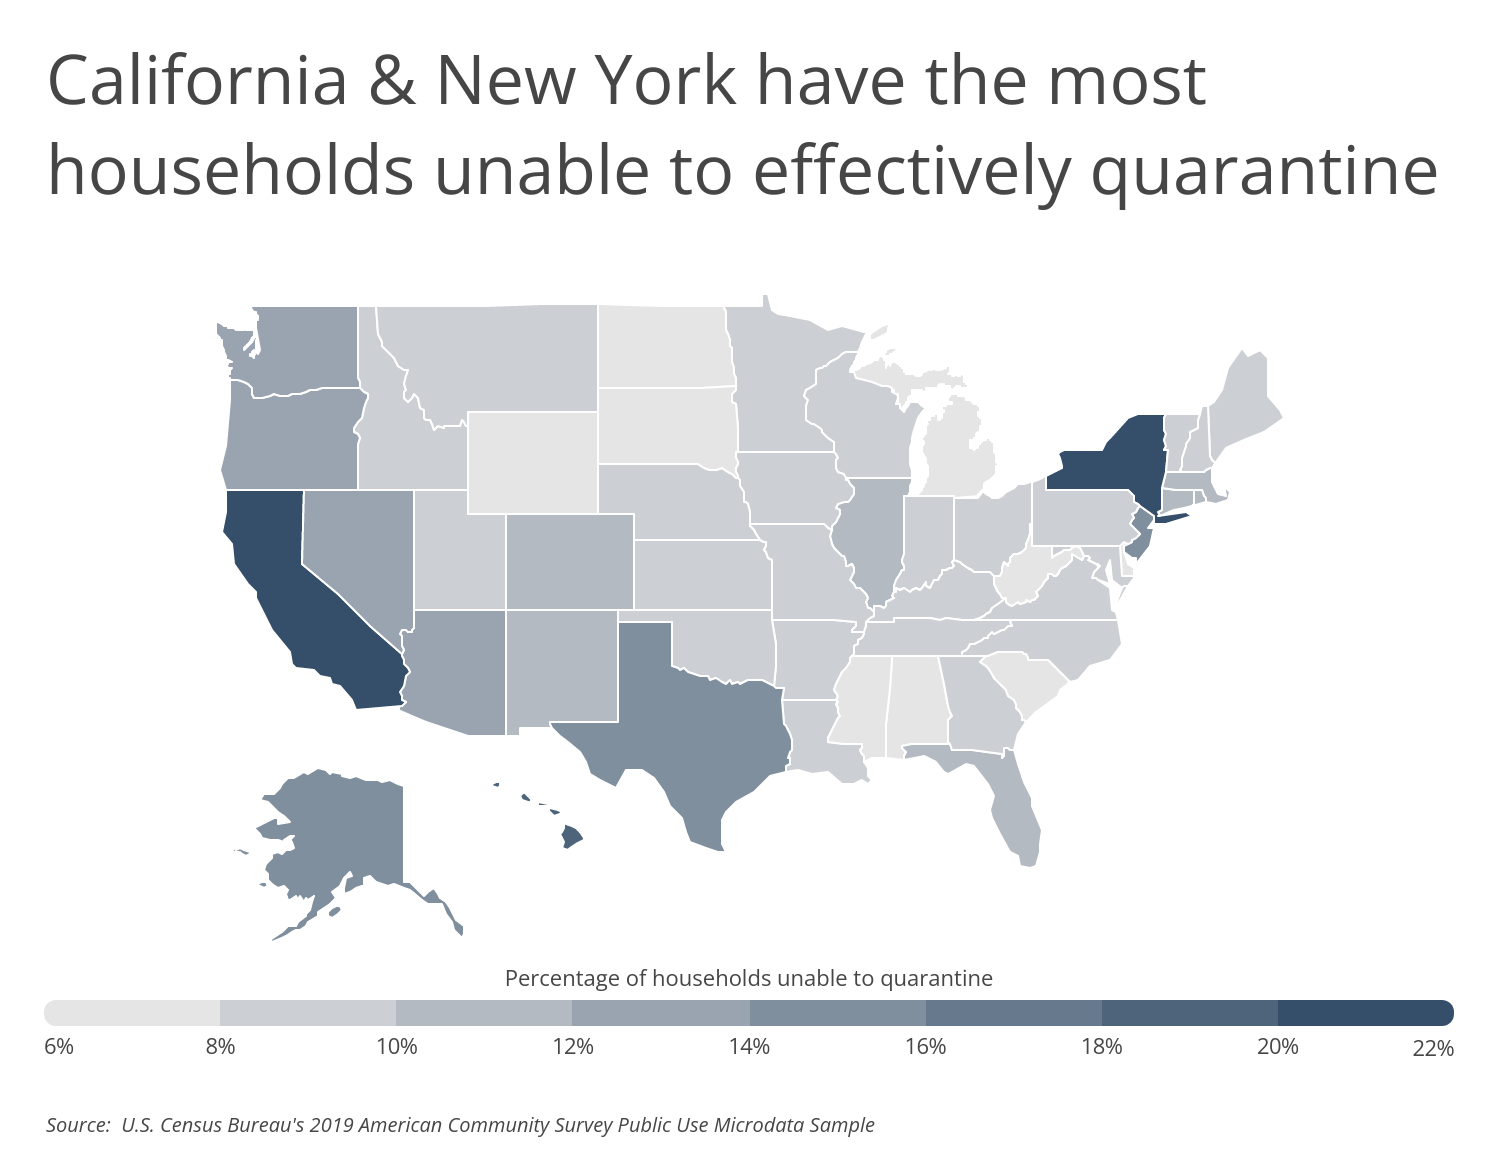
Locations with large minority populations and expensive housing are more likely to face challenges in this area. At the state level, residents of California and New York are most disadvantaged when it comes to taking effective quarantine measures. It’s estimated that more than 20% of multi-person households don’t have sufficient space to isolate an infected member of the home if needed. At the opposite end of the spectrum, residents in less expensive and less diverse states like Wyoming and West Virginia are more likely to have the necessary space to do so.

To find the metropolitan areas where residents are unable to quarantine, researchers at Smartest Dollar analyzed data from the U.S. Census Bureau. The researchers ranked metro areas according to the percentage of multi-person households without the space or facilities needed to effectively quarantine an individual. For the purpose of this analysis, this means having complete plumbing, a full kitchen, and enough bedrooms to isolate an individual without forcing the remaining household members to sleep with more than two people in a bedroom. Researchers also included the percentage of the population that is not non-Hispanic White in each location and the poverty rate.
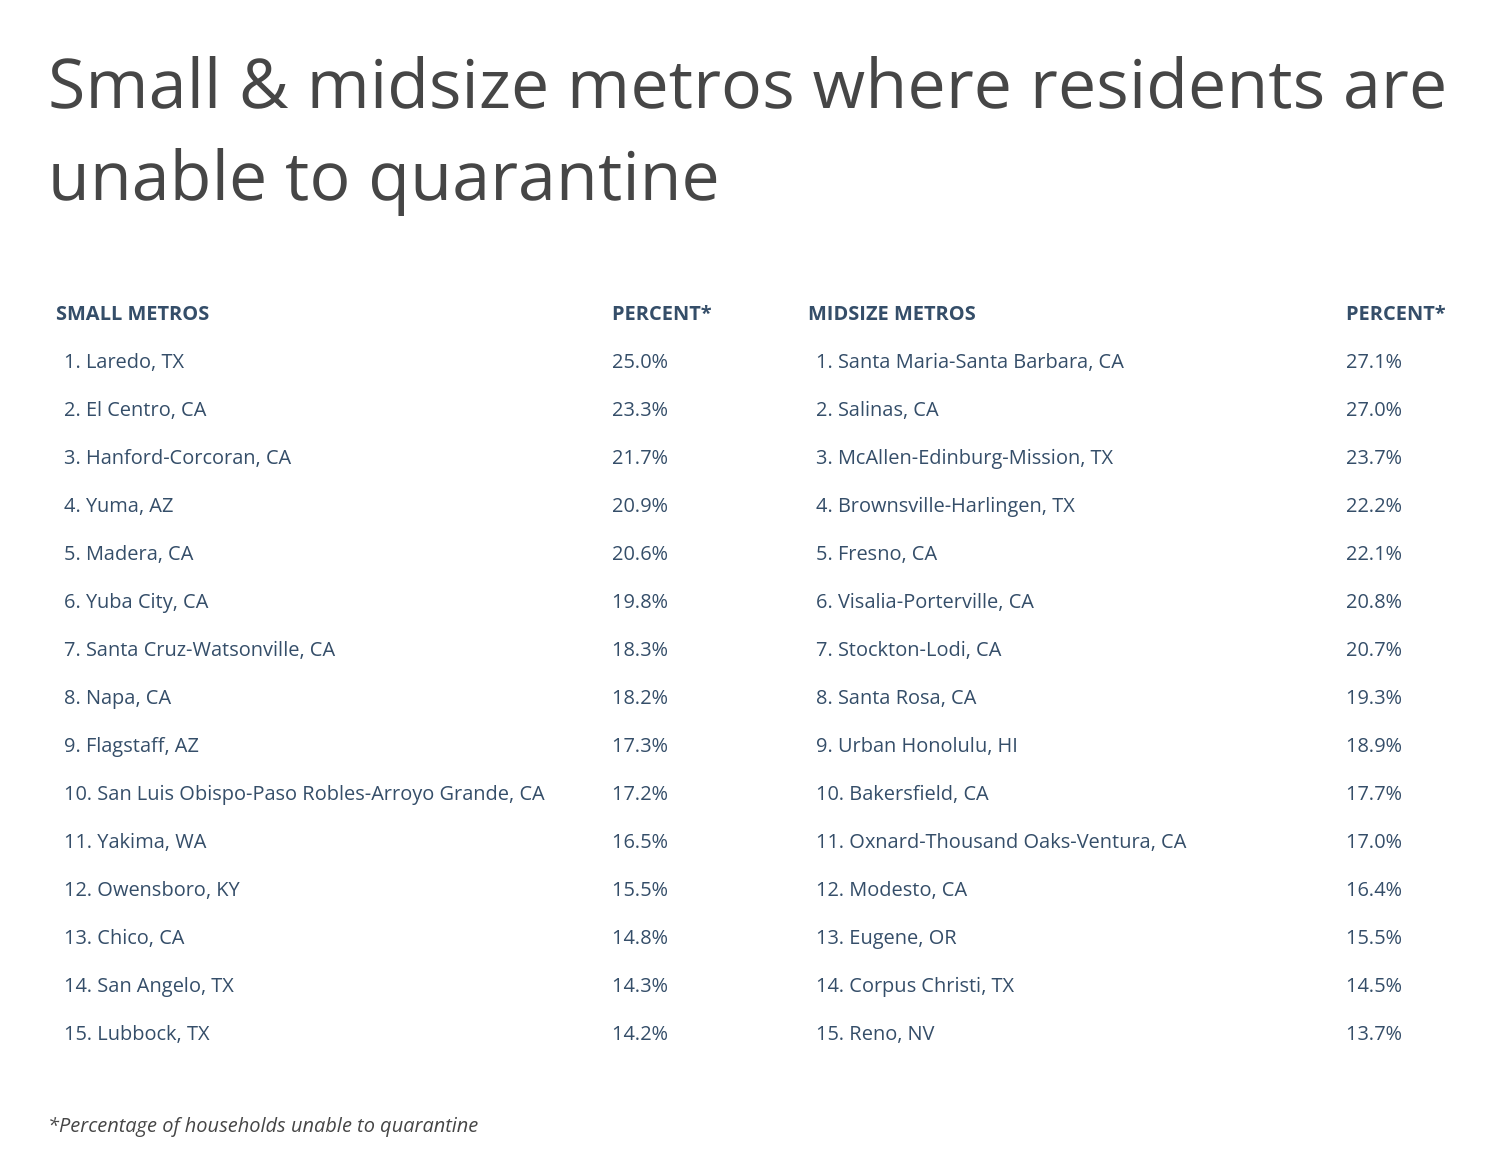
Here are the metros where residents lack the space or facilities needed to quarantine.

RELATED
In today’s hyper-competitive labor market, offering employees a generous benefits package can help attract talent, improve retention, and boost performance. In addition to health insurance, consider adding life insurance, a retirement plan, paid time off, and flexible hours.
Large Metros Where Residents Are Unable to Quarantine

Photo Credit: LHBLLC / Shutterstock
15. Tucson, AZ
- Percentage of households unable to quarantine: 14.2%
- Total households unable to quarantine: 40,004
- Minority population share: 48.9%
- Poverty rate: 13.8%

Photo Credit: Roschetzky Photography / Shutterstock
14. Austin-Round Rock, TX
- Percentage of households unable to quarantine: 14.2%
- Total households unable to quarantine: 85,951
- Minority population share: 48.4%
- Poverty rate: 10.1%

Photo Credit: Bob Pool / Shutterstock
13. Portland-Vancouver-Hillsboro, OR-WA
- Percentage of households unable to quarantine: 14.3%
- Total households unable to quarantine: 100,425
- Minority population share: 27.7%
- Poverty rate: 9.6%

Photo Credit: Sean Pavone / Shutterstock
12. San Antonio-New Braunfels, TX
- Percentage of households unable to quarantine: 14.6%
- Total households unable to quarantine: 85,677
- Minority population share: 66.8%
- Poverty rate: 13.5%

Photo Credit: Andriy Blokhin / Shutterstock
11. Sacramento–Roseville–Arden-Arcade, CA
- Percentage of households unable to quarantine: 15.0%
- Total households unable to quarantine: 95,005
- Minority population share: 48.7%
- Poverty rate: 11.9%

Photo Credit: Jeremy Janus / Shutterstock
10. Seattle-Tacoma-Bellevue, WA
- Percentage of households unable to quarantine: 15.5%
- Total households unable to quarantine: 174,215
- Minority population share: 38.3%
- Poverty rate: 7.8%

Photo Credit: CK Foto / Shutterstock
9. Dallas-Fort Worth-Arlington, TX
- Percentage of households unable to quarantine: 15.8%
- Total households unable to quarantine: 305,147
- Minority population share: 55.1%
- Poverty rate: 10.5%

Photo Credit: Jon Bilous / Shutterstock
8. Riverside-San Bernardino-Ontario, CA
- Percentage of households unable to quarantine: 17.1%
- Total households unable to quarantine: 188,528
- Minority population share: 69.3%
- Poverty rate: 12.2%

Photo Credit: nektofadeev / Shutterstock
7. Houston-The Woodlands-Sugar Land, TX
- Percentage of households unable to quarantine: 17.6%
- Total households unable to quarantine: 321,384
- Minority population share: 64.9%
- Poverty rate: 12.9%

Photo Credit: Just dance / Shutterstock
6. Miami-Fort Lauderdale-West Palm Beach, FL
- Percentage of households unable to quarantine: 18.5%
- Total households unable to quarantine: 290,188
- Minority population share: 70.5%
- Poverty rate: 13.5%

Photo Credit: Lucky-photographer / Shutterstock
5. San Diego-Carlsbad, CA
- Percentage of households unable to quarantine: 20.4%
- Total households unable to quarantine: 175,245
- Minority population share: 55.2%
- Poverty rate: 10.3%

Photo Credit: Uladzik Kryhin / Shutterstock
4. San Jose-Sunnyvale-Santa Clara, CA
- Percentage of households unable to quarantine: 22.5%
- Total households unable to quarantine: 114,398
- Minority population share: 69.5%
- Poverty rate: 6.3%

Photo Credit: Pete Niesen / Shutterstock
3. San Francisco-Oakland-Hayward, CA
- Percentage of households unable to quarantine: 23.8%
- Total households unable to quarantine: 295,921
- Minority population share: 61.4%
- Poverty rate: 8.2%

Photo Credit: Victor Moussa / Shutterstock
2. New York-Newark-Jersey City, NY-NJ-PA
- Percentage of households unable to quarantine: 24.7%
- Total households unable to quarantine: 1,294,365
- Minority population share: 54.9%
- Poverty rate: 11.6%

Photo Credit: Sean Pavone / Shutterstock
1. Los Angeles-Long Beach-Anaheim, CA
- Percentage of households unable to quarantine: 30.3%
- Total households unable to quarantine: 998,017
- Minority population share: 70.8%
- Poverty rate: 12.4%
Detailed Findings & Methodology
To find the metropolitan areas where residents are unable to quarantine, researchers at Smartest Dollar analyzed the data from the U.S. Census Bureau’s 2019 American Community Survey Public Use Microdata Sample and the 2019 American Community Survey. The researchers ranked metro areas according to the percentage of multi-person households unable to quarantine. For the purpose of this analysis, this means having complete plumbing, a full kitchen, and enough bedrooms to isolate an individual without forcing the remaining household members to sleep with more than two people in a bedroom. In the event of a tie, the metro with the larger percentage of households without a full kitchen or complete plumbing was ranked higher. Researchers also calculated the total number of multi-person households unable to quarantine and the poverty rate.
It’s important to note that ideally this study would have also considered the number of bathrooms available, such that the quarantined individual would not only use their own bedroom but their own bathroom too. The Census Bureau, unfortunately, does not collect this data at the household level. As such the estimates presented in this analysis are likely underestimates based on the CDCs recommendation that a quarantined individual should use a separate bathroom if possible.
To improve relevance, only metropolitan areas with at least 100,000 people were included in the analysis. Additionally, metro areas were grouped into the following cohorts based on population size: small: 100,000–349,999; midsize: 350,000–999,999; large: 1,000,000 or more.
By clicking the above links, you will go to one of our insurance partners. The specific companies listed above may not be included in our partner's network at this time.
