Cities With the Most Single Parents
According to a recent Pew Research Center report, children in the United States are more likely to live in a single-parent household than children in at least 129 other countries, including China, India, and all of Europe. Maintaining a household as a single parent presents a number of challenges, the largest of which for many single-parent families are financial.
According to the Bureau of Labor Statistics’ 2018 Consumer Expenditure Survey, single parents with minor children devote a larger share of their spending on necessary costs of living, like food and housing, than married parents do. COVID-19 has only intensified the challenges faced by single parents. Those who have lost their jobs might struggle to cover living expenses, while those still employed must cope with a lack of child care options and schools being closed.
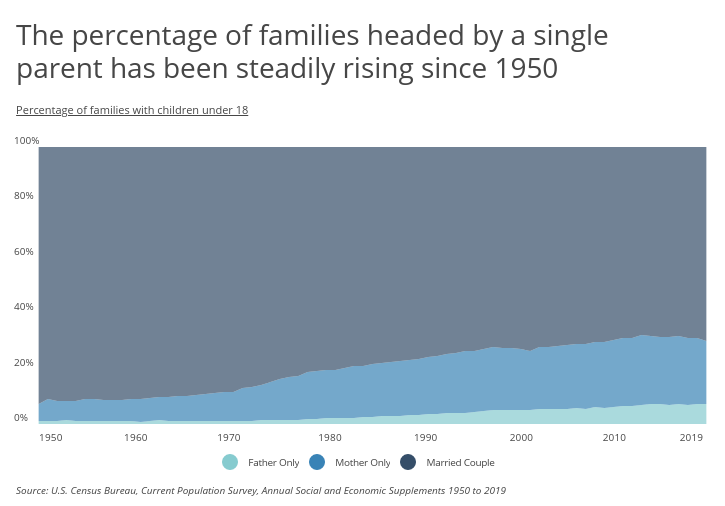
In spite of the strain experienced by many single parents, the percentage of single-parent households has tripled from less than 10 percent of families with children in 1950 to about 30 percent in 2019. The 22.7 percent of households with children that were headed by a single mother last year represents the lowest percentage of single-mother households since 2003. On the other hand, single-father households reached an all-time high of 7.4 percent in 2019. In 1950, single-father households accounted for only 1.1 percent of households with kids.

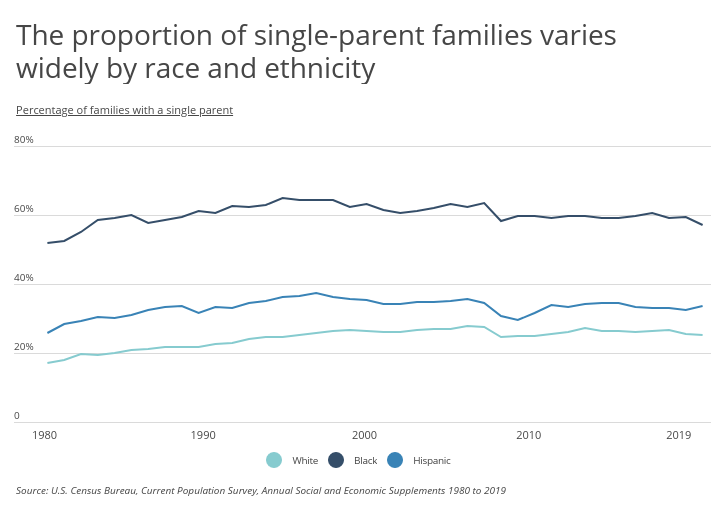
The proportion of single-parent families also varies widely by race and ethnicity. According to the U.S. Census Bureau’s Current Population Survey, about one in four white families, and one in three Hispanic families, are headed by a single parent. Meanwhile, nearly 60 percent of black families are headed by a single parent, although this represents the lowest value since 1982. The percentage of white and Hispanic single-parent families has increased by 5.5 and 4.1 percentage points, respectively, over the same time period.

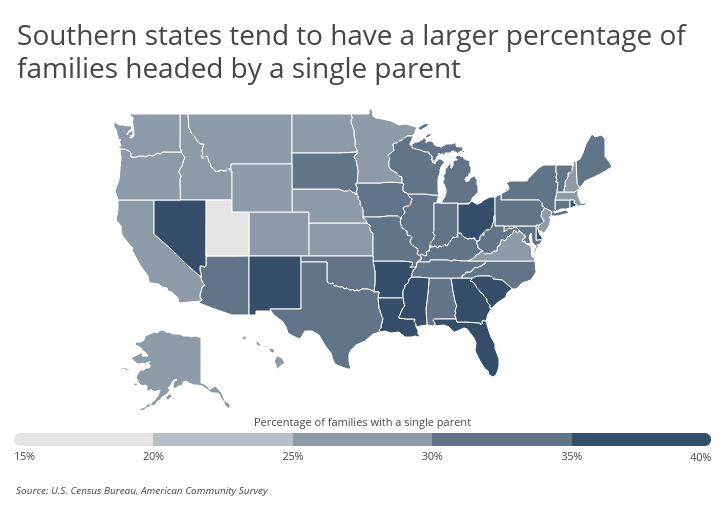
Geographically, Southern states tend to have the highest percentage of single-parent households, with Louisiana leading the nation at just over 40 percent. Mississippi, South Carolina, Arkansas, Florida, and Georgia all report percentages of at least 35 percent. Only 19 percent of family households in Utah are headed by a single parent. Hawaii and Idaho have the second and third lowest rates of single parenting, both at about 26 percent.

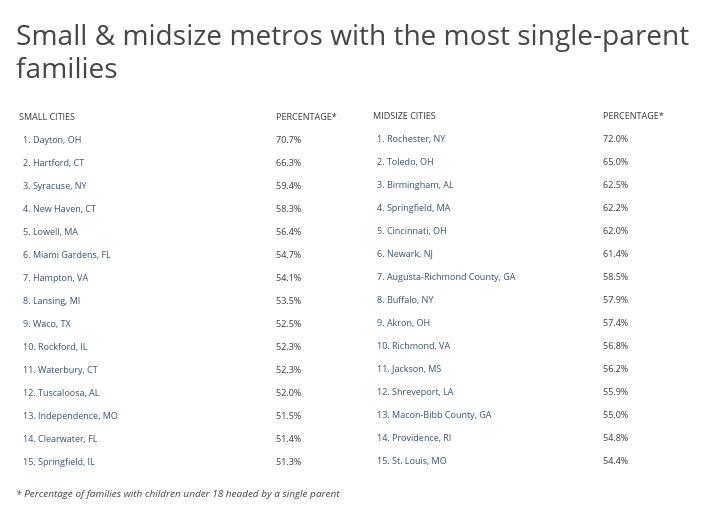
To determine which cities have the most single parents, researchers at Smartest Dollar analyzed data from the U.S. Census Bureau’s 2018 American Community Survey. For each city, researchers calculated the percentage of families with children under 18 living in households headed by a single parent. The analysis also includes the percentage of households with single moms, single dads, and the total number of households headed by a single parent in each location. To improve relevance, only cities with at least 100,000 residents were included in the analysis. Furthermore, separate rankings were generated for small (100,000–149,999 residents), midsize (150,000–349,999 residents), and large cities (350,000 residents or more).
Consistent with state-level trends, researchers found that a number of cities in the South report a high percentage of single-parent households. Several cities in the Midwest also appear atop the rankings, including Cleveland with the national high of 73.3 percent of single-parent households.
Here are the U.S. cities with the most single parents.

Large Cities With the Most Single Parents
Photo Credit: Alamy Stock Photo
15. Albuquerque, NM
- Percentage of families with a single parent: 43.8%
- Total families with a single parent: 23,277
- Percentage of families with a single mom: 30.9%
- Percentage of families with a single dad: 12.9%
Photo Credit: Alamy Stock Photo
14. Fresno, CA
- Percentage of families with a single parent: 44.9%
- Total families with a single parent: 25,835
- Percentage of families with a single mom: 34.4%
- Percentage of families with a single dad: 10.5%
Photo Credit: Alamy Stock Photo
13. Tucson, AZ
- Percentage of families with a single parent: 45.4%
- Total families with a single parent: 23,056
- Percentage of families with a single mom: 32.9%
- Percentage of families with a single dad: 12.5%
Photo Credit: Alamy Stock Photo
12. Atlanta, GA
- Percentage of families with a single parent: 46.1%
- Total families with a single parent: 17,054
- Percentage of families with a single mom: 39.8%
- Percentage of families with a single dad: 6.3%
Photo Credit: Alamy Stock Photo
11. Boston, MA
- Percentage of families with a single parent: 46.8%
- Total families with a single parent: 24,266
- Percentage of families with a single mom: 40.4%
- Percentage of families with a single dad: 6.4%
Photo Credit: Alamy Stock Photo
10. Washington, DC
- Percentage of families with a single parent: 47.7%
- Total families with a single parent: 24,096
- Percentage of families with a single mom: 38.9%
- Percentage of families with a single dad: 8.8%
Photo Credit: Alamy Stock Photo
9. Indianapolis, IN
- Percentage of families with a single parent: 48.9%
- Total families with a single parent: 39,765
- Percentage of families with a single mom: 38.3%
- Percentage of families with a single dad: 10.7%
Photo Credit: Alamy Stock Photo
8. Columbus, OH
- Percentage of families with a single parent: 49.4%
- Total families with a single parent: 43,827
- Percentage of families with a single mom: 38.3%
- Percentage of families with a single dad: 11.1%
Photo Credit: Alamy Stock Photo
7. Baltimore, MD
- Percentage of families with a single parent: 52.7%
- Total families with a single parent: 24,131
- Percentage of families with a single mom: 45.2%
- Percentage of families with a single dad: 7.6%
Photo Credit: Alamy Stock Photo
6. New Orleans, LA
- Percentage of families with a single parent: 52.8%
- Total families with a single parent: 13,566
- Percentage of families with a single mom: 44.2%
- Percentage of families with a single dad: 8.7%
Photo Credit: Alamy Stock Photo
5. Philadelphia, PA
- Percentage of families with a single parent: 57.0%
- Total families with a single parent: 79,749
- Percentage of families with a single mom: 46.3%
- Percentage of families with a single dad: 10.7%
Photo Credit: Alamy Stock Photo
4. Milwaukee, WI
- Percentage of families with a single parent: 58.9%
- Total families with a single parent: 36,742
- Percentage of families with a single mom: 46.1%
- Percentage of families with a single dad: 12.8%
Photo Credit: Alamy Stock Photo
3. Memphis, TN
- Percentage of families with a single parent: 63.1%
- Total families with a single parent: 37,284
- Percentage of families with a single mom: 53.9%
- Percentage of families with a single dad: 9.3%
Photo Credit: Alamy Stock Photo
2. Detroit, MI
- Percentage of families with a single parent: 72.0%
- Total families with a single parent: 44,234
- Percentage of families with a single mom: 59.0%
- Percentage of families with a single dad: 13.0%
Photo Credit: Alamy Stock Photo
1. Cleveland, OH
- Percentage of families with a single parent: 73.3%
- Total families with a single parent: 26,434
- Percentage of families with a single mom: 58.3%
- Percentage of families with a single dad: 15.0%
Methodology & Full Results
Researchers used data from the U.S. Census Bureau’s 2018 American Community Survey to determine the percentage of all households with children under 18 that are headed by a single parent. The total number of households with children under 18 that are headed by single moms and single dads was divided by the total number of households with children under 18. In determining which cities have the most single parents, researchers made this calculation for all cities with at least 100,000 residents and sorted the results by those with the highest share of single-parent households. To improve relevance, cities were grouped into the following cohorts based on population:
- Small cities: 100,000–149,999 residents
- Midsize cities: 150,000–349,999 residents
- Large cities: 350,000 residents or more
Family data depicted in the first chart of this report was derived from the U.S. Census Bureau’s Current Population Survey, Annual Social and Economic Supplements 1950 to 2019. The same Current Population Survey was used to develop the second chart in this report looking at variations in single-parent families by race and ethnicity. In the data used to make the chart, respondents selected only one race, and those who identified as being of Hispanic origin were able to identify with any race.
By clicking the above links, you will go to one of our insurance partners. The specific companies listed above may not be included in our partner's network at this time.


