Cities With the Most Manufacturing Jobs
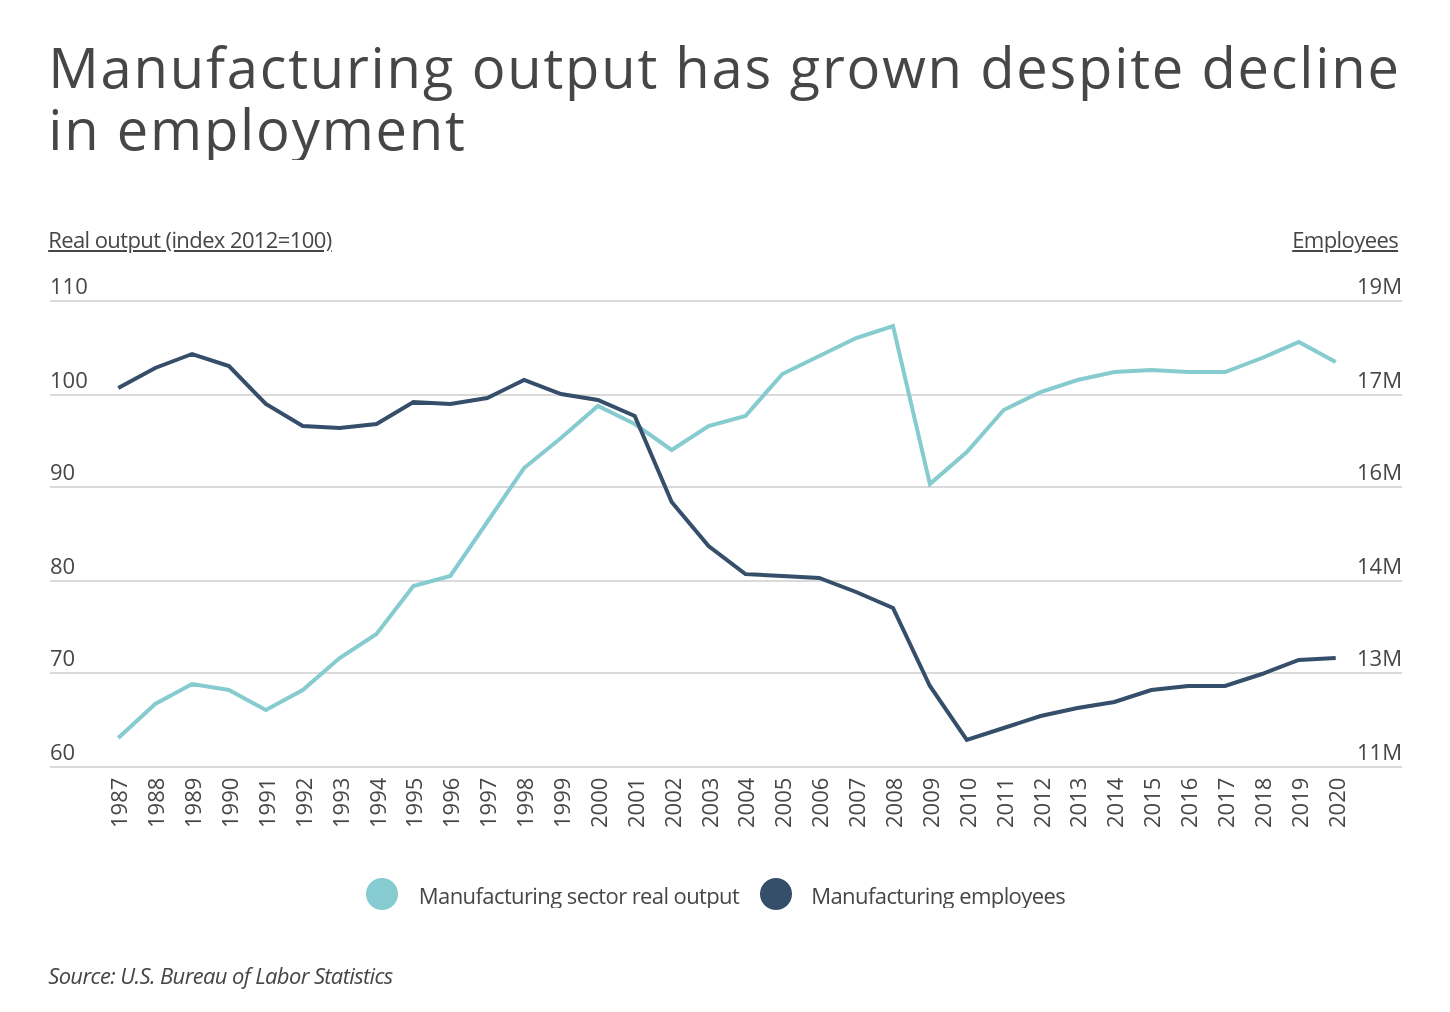
Since its peak in 1979, manufacturing employment in the U.S. has been on the decline, accelerating sharply around the turn of the century. Despite modest gains since 2010, the number of manufacturing jobs remains far below previous levels. According to data from the U.S. Bureau of Labor Statistics (BLS), manufacturing accounted for more than 13 percent of the U.S. nonfarm workforce in 1999, or 17.3 million jobs. As of 2019, just 8.5 percent of workers were employed in the manufacturing sector, totaling less than 13 million jobs.
Interestingly, at the same time that manufacturing jobs have moved overseas, manufacturing output-measured as the value of goods and services produced in the U.S.-has increased steadily. In fact, the BLS’s index of labor productivity for manufacturing is 2.5 times greater than it was in 1987 (the earliest year for which the data is available) due to advances in machinery, increased worker skill, and improved industrial processes.
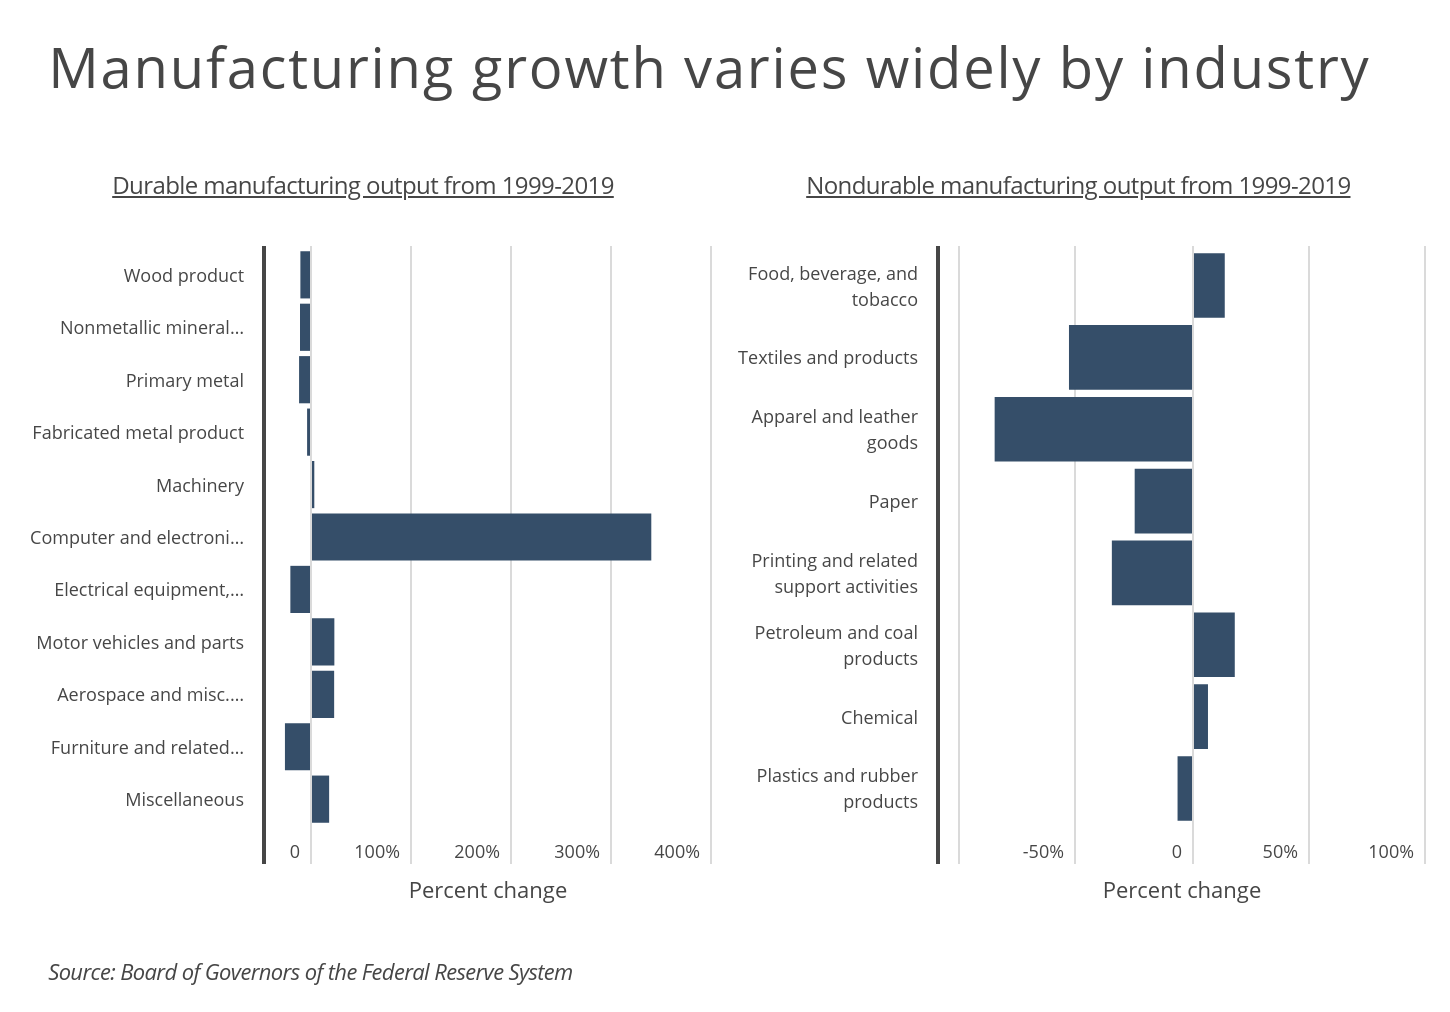
Although manufacturing output has grown overall, the growth has not been equal among manufacturing subsectors. Between 1999 and 2019, overall durable goods manufacturing output increased by 36.4 percent. While a number of durable goods manufacturing sectors decreased in output, computer and electronic products production more than tripled. In contrast, overall nondurable manufacturing output fell by 3.6 percent over the last 20 years, with the steepest declines observed in apparel and textiles.
RELATED
Do you operate a manufacturing business? It’s important to have robust product liability insurance as well as other common types of small business insurance, including general liability and commercial building insurance.
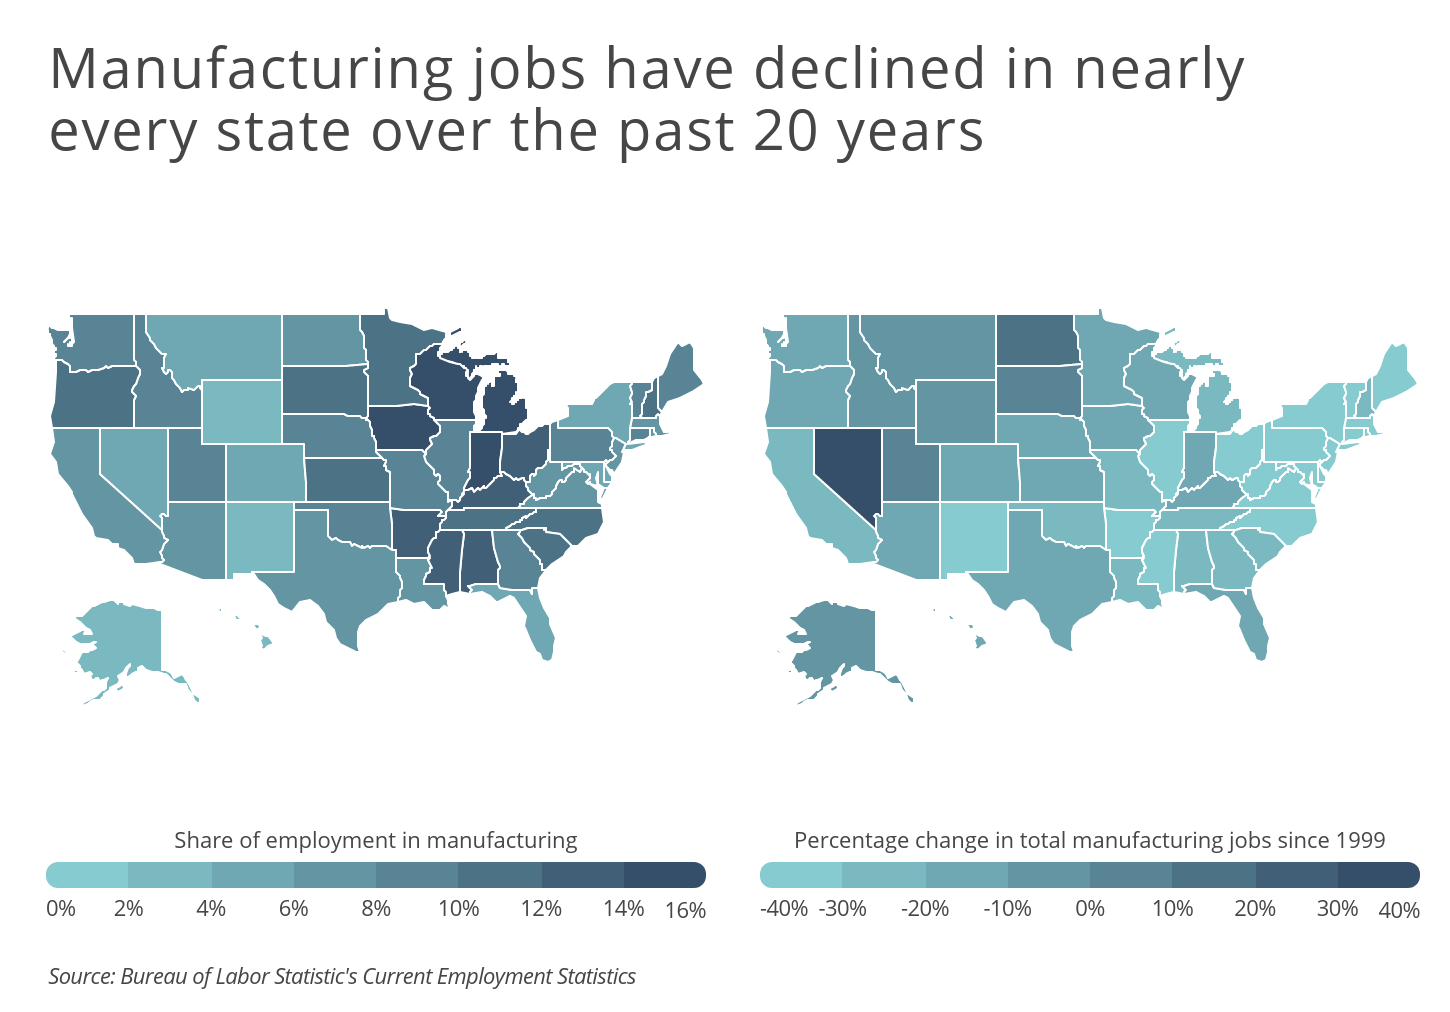
The share of employment in manufacturing varies significantly across cities and states-some parts of the country depend much more on manufacturing work than others. The change in manufacturing jobs over the last two decades also differs substantially on a geographic basis. Even states with the largest share of employment in manufacturing today have lost large numbers of manufacturing jobs. While Indiana and Wisconsin have 17.1 and 16.2 percent of their employment in manufacturing, respectively, they have each lost more than 100,000 manufacturing jobs since 1999.
To find the metropolitan areas with the most manufacturing jobs, researchers at Smartest Dollar used employment data from the Bureau of Labor Statistics. The researchers ranked metro areas according to the share of workers employed in manufacturing. Researchers also looked at the percentage change in total manufacturing jobs since 1999 and the total number of manufacturing jobs in 2019 and 1999.
To improve relevance, only metropolitan areas with at least 100,000 people were included in the analysis. Additionally, metro areas were grouped into the following cohorts based on population size:
- Small metros: 100,000–349,999
- Midsize metros: 350,000–999,999
- Large metros: 1,000,000 or more
Here are the metropolitan areas with the largest share of workers employed in manufacturing.
Large Metros With the Most Manufacturing Jobs

Photo Credit: Alamy Stock Photo
15. Seattle-Tacoma-Bellevue, WA
- Share of employment in manufacturing: 8.8%
- Change in total manufacturing jobs since 1999: -19.1% (43,700 total jobs lost)
- Total manufacturing jobs 2019: 184,700
- Total manufacturing jobs 1999: 228,400
RELATED
Among broad industry sectors, manufacturing faces some of the highest rates of occupational injuries and illnesses, according to the BLS. That’s why manufacturing workers who have family that depend on them financially should consider a life insurance policy. The best life insurance companies will provide financial protection for your family at a reasonable price.

Photo Credit: Alamy Stock Photo
14. Chicago-Naperville-Elgin, IL-IN-WI
- Share of employment in manufacturing: 8.8%
- Change in total manufacturing jobs since 1999: -35.3% (229,100 total jobs lost)
- Total manufacturing jobs 2019: 419,500
- Total manufacturing jobs 1999: 648,600

Photo Credit: Alamy Stock Photo
13. Charlotte-Concord-Gastonia, NC-SC
- Share of employment in manufacturing: 9.0%
- Change in total manufacturing jobs since 1999: -29.3% (46,000 total jobs lost)
- Total manufacturing jobs 2019: 111,200
- Total manufacturing jobs 1999: 157,200

Photo Credit: Alamy Stock Photo
12. Buffalo-Cheektowaga, NY
- Share of employment in manufacturing: 9.3%
- Change in total manufacturing jobs since 1999: -37.1% (30,900 total jobs lost)
- Total manufacturing jobs 2019: 52,400
- Total manufacturing jobs 1999: 83,300

Photo Credit: Alamy Stock Photo
11. Minneapolis-St. Paul-Bloomington, MN-WI
- Share of employment in manufacturing: 9.9%
- Change in total manufacturing jobs since 1999: -17.0% (41,200 total jobs lost)
- Total manufacturing jobs 2019: 200,700
- Total manufacturing jobs 1999: 241,900

Photo Credit: Alamy Stock Photo
10. Hartford-West Hartford-East Hartford, CT
- Share of employment in manufacturing: 10.4%
- Change in total manufacturing jobs since 1999: -21.0% (16,100 total jobs lost)
- Total manufacturing jobs 2019: 60,400
- Total manufacturing jobs 1999: 76,500

Photo Credit: Alamy Stock Photo
9. Rochester, NY
- Share of employment in manufacturing: 10.5%
- Change in total manufacturing jobs since 1999: -47.5% (51,100 total jobs lost)
- Total manufacturing jobs 2019: 56,500
- Total manufacturing jobs 1999: 107,600

Photo Credit: Alamy Stock Photo
8. Portland-Vancouver-Hillsboro, OR-WA
- Share of employment in manufacturing: 10.6%
- Change in total manufacturing jobs since 1999: -8.9% (12,700 total jobs lost)
- Total manufacturing jobs 2019: 129,300
- Total manufacturing jobs 1999: 142,000

Photo Credit: Alamy Stock Photo
7. Cincinnati, OH-KY-IN
- Share of employment in manufacturing: 10.8%
- Change in total manufacturing jobs since 1999: -18.8% (27,900 total jobs lost)
- Total manufacturing jobs 2019: 120,600
- Total manufacturing jobs 1999: 148,500

Photo Credit: Alamy Stock Photo
6. Cleveland-Elyria, OH
- Share of employment in manufacturing: 11.4%
- Change in total manufacturing jobs since 1999: -37.2% (73,000 total jobs lost)
- Total manufacturing jobs 2019: 123,500
- Total manufacturing jobs 1999: 196,500

Photo Credit: Alamy Stock Photo
5. Louisville/Jefferson County, KY-IN
- Share of employment in manufacturing: 12.3%
- Change in total manufacturing jobs since 1999: -12.7% (12,100 total jobs lost)
- Total manufacturing jobs 2019: 83,000
- Total manufacturing jobs 1999: 95,100

Photo Credit: Alamy Stock Photo
4. Detroit-Warren-Dearborn, MI
- Share of employment in manufacturing: 12.6%
- Change in total manufacturing jobs since 1999: -30.6% (113,900 total jobs lost)
- Total manufacturing jobs 2019: 257,900
- Total manufacturing jobs 1999: 371,800

Photo Credit: Alamy Stock Photo
3. Milwaukee-Waukesha, WI
- Share of employment in manufacturing: 13.7%
- Change in total manufacturing jobs since 1999: -28.4% (47,500 total jobs lost)
- Total manufacturing jobs 2019: 120,000
- Total manufacturing jobs 1999: 167,500

Photo Credit: Alamy Stock Photo
2. San Jose-Sunnyvale-Santa Clara, CA
- Share of employment in manufacturing: 15.1%
- Change in total manufacturing jobs since 1999: -26.6% (62,700 total jobs lost)
- Total manufacturing jobs 2019: 173,000
- Total manufacturing jobs 1999: 235,700

Photo Credit: Alamy Stock Photo
1. Grand Rapids-Kentwood, MI
- Share of employment in manufacturing: 21.0%
- Change in total manufacturing jobs since 1999: -9.0% (11,800 total jobs lost)
- Total manufacturing jobs 2019: 119,000
- Total manufacturing jobs 1999: 130,800
Detailed Findings & Methodology
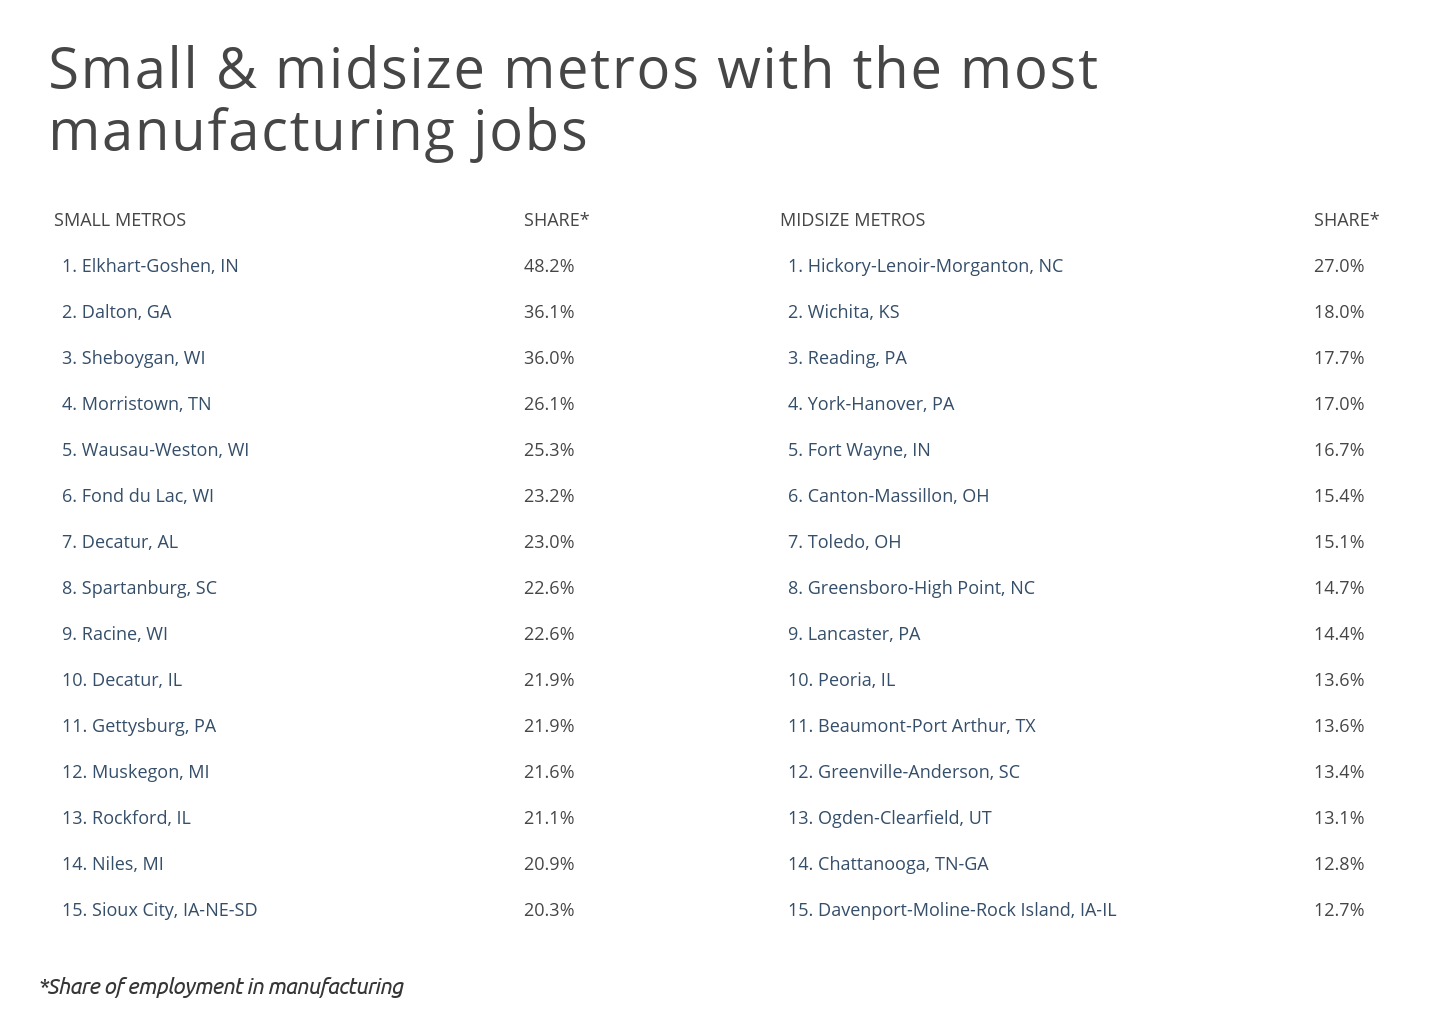
The Midwest is home to many of the metropolitan areas with the most manufacturing jobs. At over twice the national average, the Grand Rapids metro area boasts the largest share of employment in manufacturing, at 21 percent. While manufacturing remains an important economic driver for these manufacturing-centric areas, the large and midsize metros with the most manufacturing jobs have lost about one-fourth of these jobs on average since 1999. Changes in manufacturing employment for the small metros with the most manufacturing jobs have been more tempered-these cities have lost about 15 percent of their manufacturing jobs on average.
Both manufacturing employment and output plummeted during the Great Recession. Undoubtedly, the current recession will also impact the manufacturing sector, but the recovery may be quicker than in other hard-hit industries such as hospitality, travel, and tourism. While manufacturing employment has dropped significantly in the last several decades, manufacturing remains a vital industry to many parts of the country.
To find the cities with the most manufacturing jobs, researchers at Smartest Dollar used data from the Bureau of Labor Statistics’s Current Employment Survey for 1999 and 2019. The researchers ranked metro areas according to the share of nonfarm employment working in the manufacturing sector. In the event of a tie, the metro with the larger number of manufacturing jobs was ranked higher. Researchers also looked at the percentage change in total manufacturing jobs from 1999 to 2019 and the total numbers of manufacturing jobs in 2019 and 1999.
To improve relevance, only metropolitan areas with at least 100,000 people were included in the analysis. Additionally, metro areas were grouped into the following cohorts based on population size:
- Small metros: 100,000–349,999
- Midsize metros: 350,000–999,999
- Large metros: 1,000,000 or more
By clicking the above links, you will go to one of our insurance partners. The specific companies listed above may not be included in our partner's network at this time.