U.S. Cities With the Most Analytical Workers [2023 Edition]
After major breakthroughs in the field of artificial intelligence in recent years, AI is quickly becoming an everyday presence in people’s lives. The release of generative AI tools like ChatGPT, DALL-E 2, and Stable Diffusion in 2022 captured public attention and demonstrated AI’s potential in intuitive ways. In response, tech giants like Microsoft, Alphabet, and Meta are racing to incorporate new AI technology into their popular products.
Despite the exciting possibilities for AI and machine learning, these emerging technologies have also raised fears of job displacement. These tools have the potential to perform many tasks that were previously thought to be more difficult to automate, from design to customer service to computer programming.
But concerns about automation are nothing new, and history has shown that while technological innovation does eliminate some jobs, it also frequently creates new roles requiring different skill sets. For instance, digital automation from the invention of computers and the internet made many production and clerical occupations obsolete. At the same time, the digital revolution created well-paid jobs for highly educated analytical workers who understand and know how to leverage new technology.
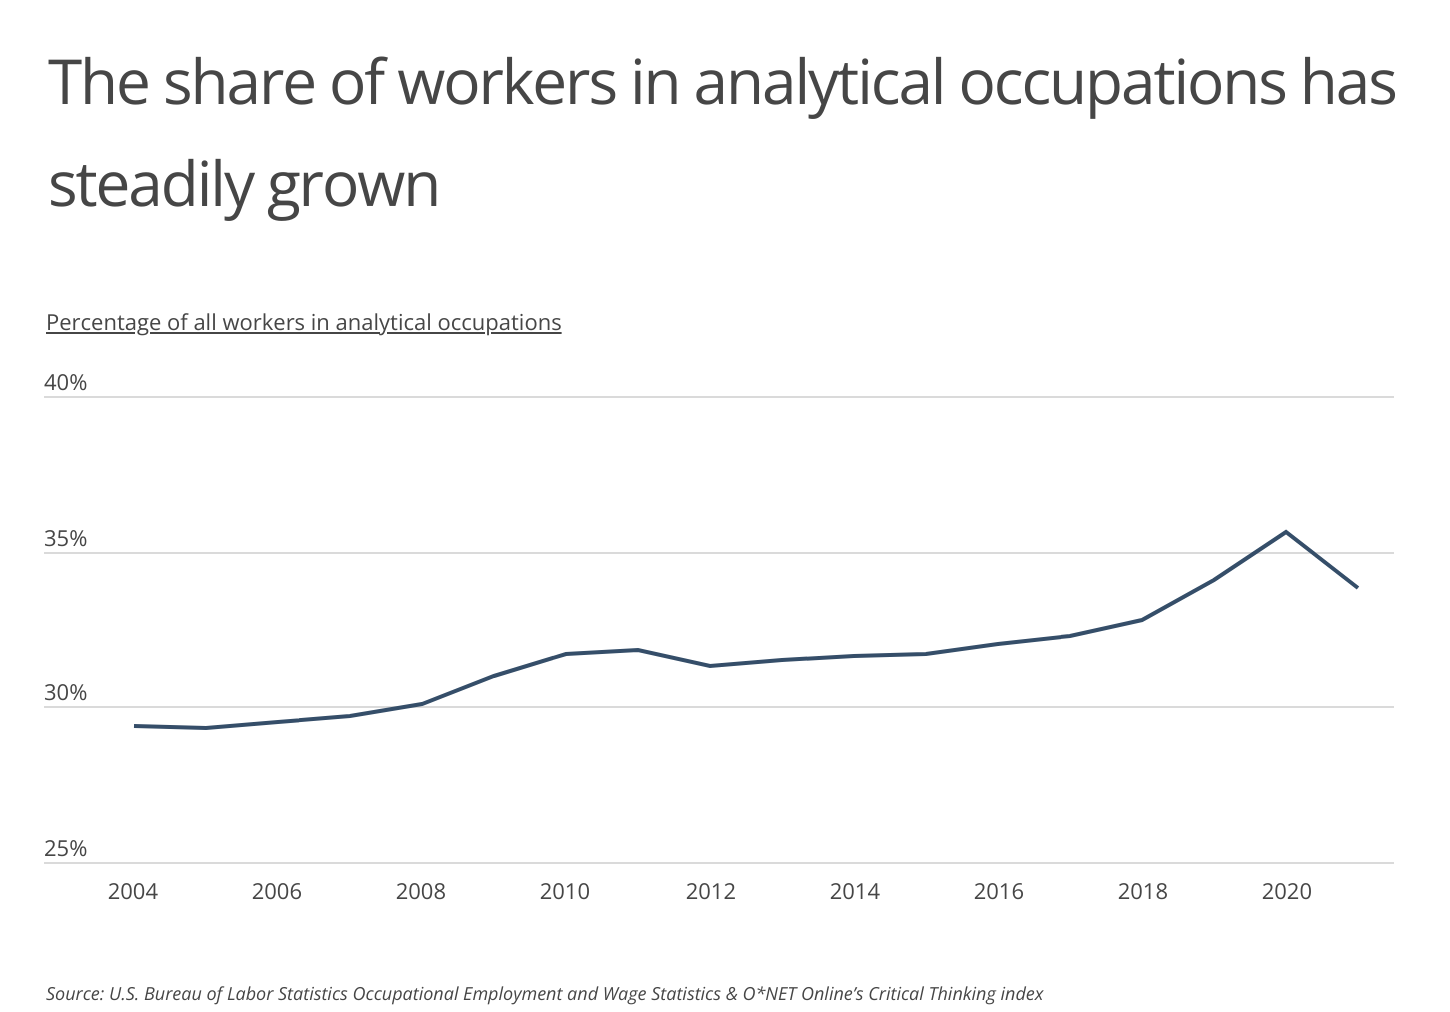
In today’s digital economy, these types of analytical jobs have become increasingly important and are likely to remain so as more businesses rely on technology. Twenty years ago, analytical workers-defined as those in occupations that rank in the top 50% for O*NET’s Critical Thinking index-represented 29.4% of workers in the economy. That figure today is 33.8%, down slightly from its 2020 peak of 35.6%.
RELATED
One way that companies might attract top-notch employees is by providing D&O insurance, designed specifically to protect the personal assets of directors and officers. With the best D&O insurance, business owners can ensure that those in management are focusing on doing their best work instead of fearing the risks that come with the role.
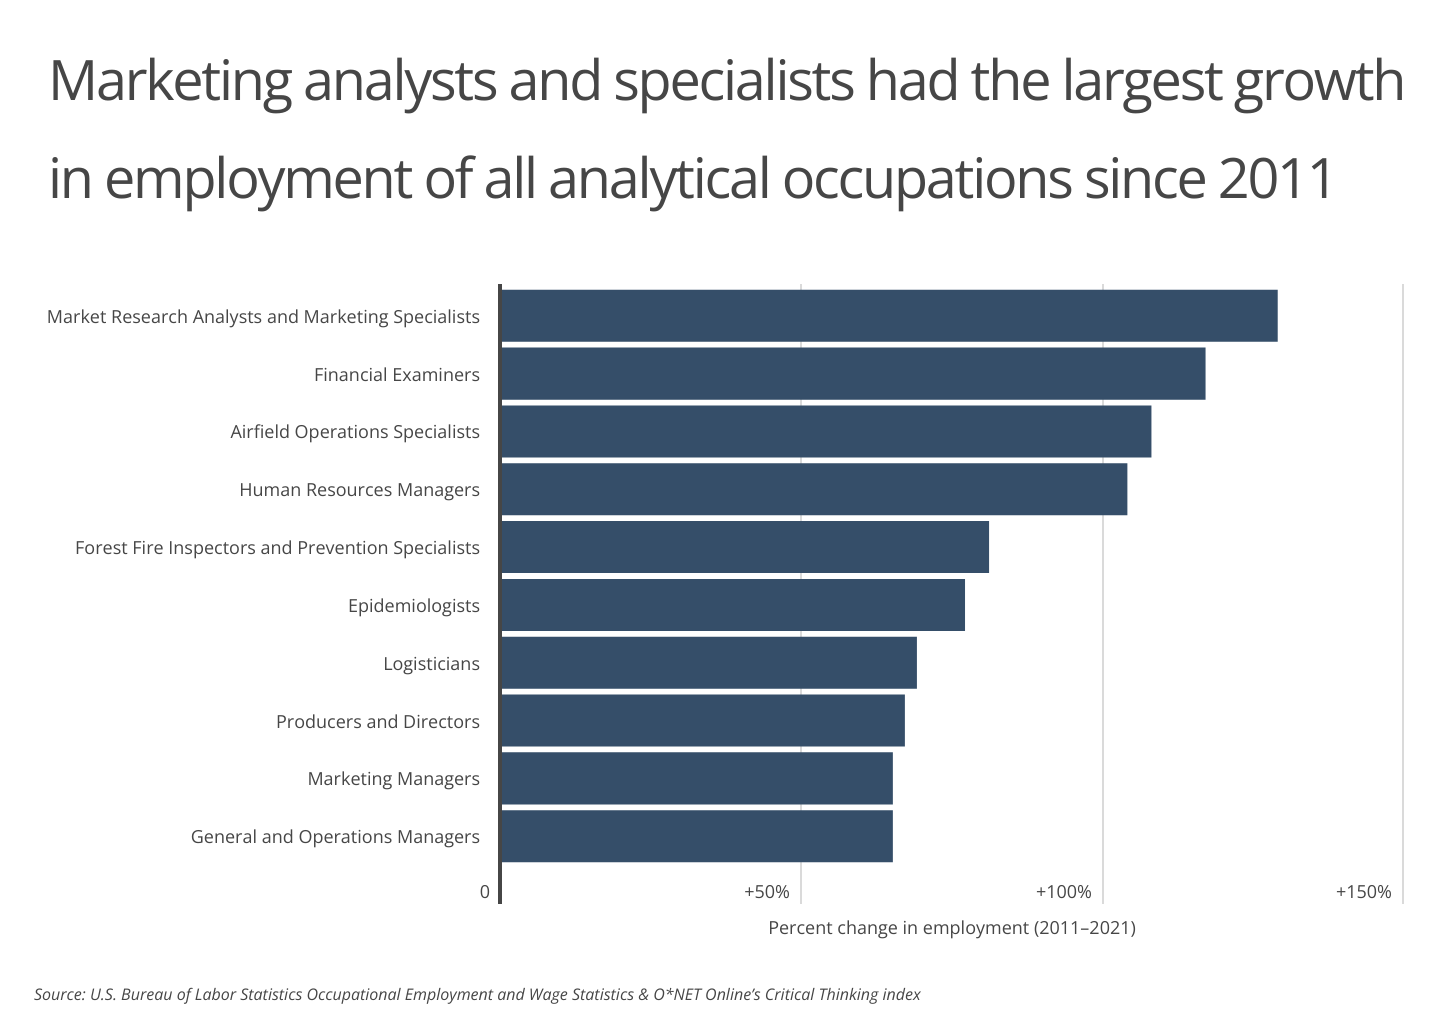
While needs for analytical workers have grown across the economy, demand for critical thinking skills has been especially high for certain fields. Roles in business operations and management have shown the highest rate of growth over the last decade. These fast-growing analytical occupations include market research analysts, financial examiners, and human resources managers, which all saw total employment more than double from 2011 to 2021. Meanwhile, the occupation general and operations managers saw total employment grow by more than one million workers over the same span, becoming the second largest analytical occupation.
FOR BUSINESS OWNERS
There is a wide variety of harms that can lead to a liability claim against a business. Businesses that provide professional services can be held liable for failing to perform a service as agreed or for a misrepresentation that results in harm to a customer or client. This is why it’s critical for a business owner to have the best professional liability insurance, which provides financial protection when a business is found liable for harm to another.
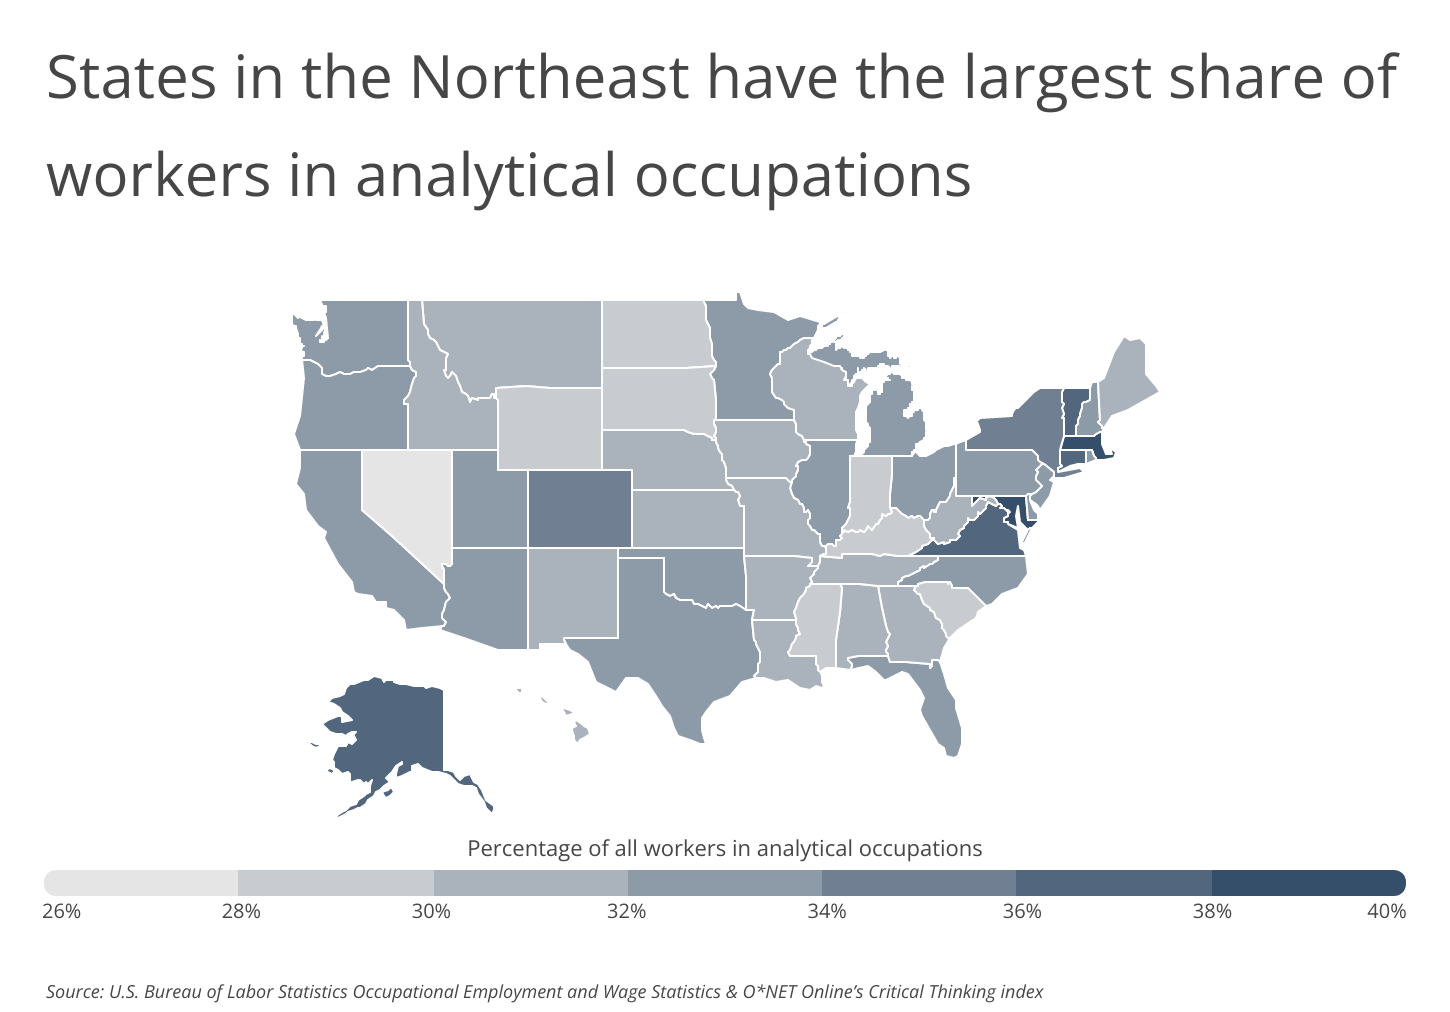
Geographically, demand for workers in analytical occupations depends on factors specific to state and local economies. States like Massachusetts, Maryland, and Connecticut have the highest share of workers in analytical occupations, a byproduct of high educational attainment in their populations and industry makeups that require more analytical workers. At the opposite end of the spectrum is Nevada, a state where much of the economy is linked to hospitality and the service industry, where analytical skills are less in-demand.
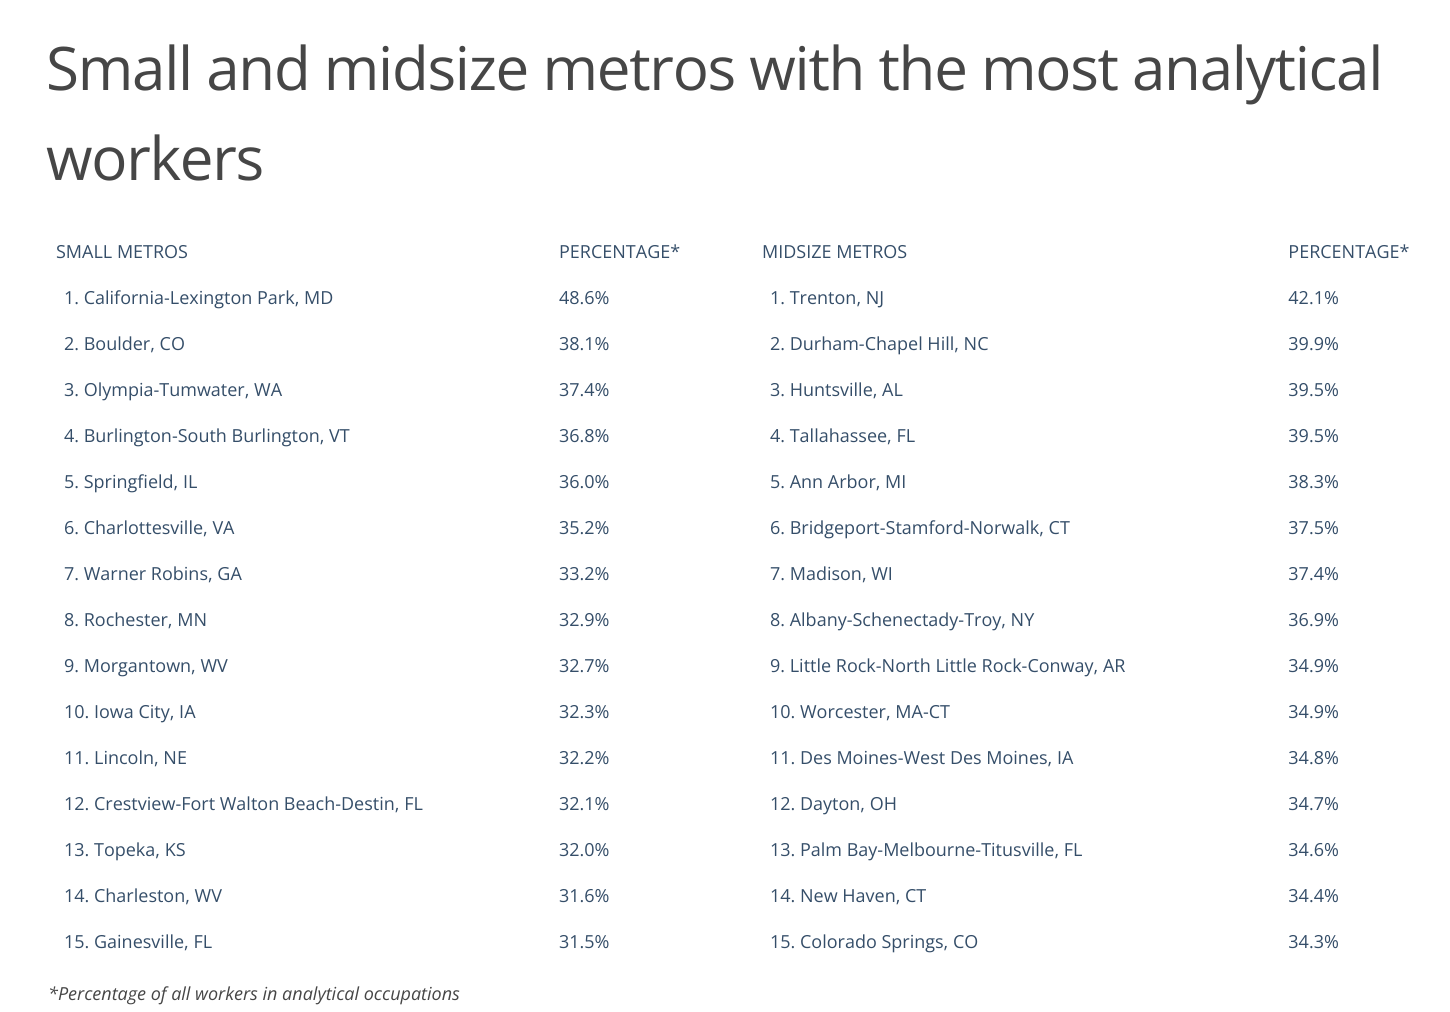
Similarly, most metros with higher-than-average concentrations of analytical workers are cities with highly educated workforces and economies based in industries heavy in analytical needs like tech, financial services, law, and other big business. In the nation’s leading metro for analytical workers-the Washington, D.C. metro-nearly half of the population works in occupations that depend heavily on critical thinking skills.
The data used in this analysis is from the U.S. Bureau of Labor Statistics as well as O*NET Online. To determine the locations with the most analytical workers, researchers at Smartest Dollar calculated the percentage of all workers in analytical occupations-or occupations that rank in the top 50% for O*NET’s Critical Thinking index. In the event of a tie, the location with the greater total workers in analytical occupations was ranked higher.
Here are the U.S. metropolitan areas with the most analytical workers.
Large Metros With the Most Analytical Workers

Photo Credit: Farid Sani / Shutterstock
15. Raleigh, NC
- Percentage of all workers in analytical occupations: 35.5%
- Concentration of workers in analytical occupations (compared to average): +5.0%
- Total workers in analytical occupations: 225,080
- Total workers in non-analytical occupations: 408,180

Photo Credit: dibrova / Shutterstock
14. New York-Newark-Jersey City, NY-NJ-PA
- Percentage of all workers in analytical occupations: 35.6%
- Concentration of workers in analytical occupations (compared to average): +5.3%
- Total workers in analytical occupations: 3,088,070
- Total workers in non-analytical occupations: 5,590,040

Photo Credit: Andriy Blokhin / Shutterstock
13. Sacramento–Roseville–Arden-Arcade, CA
- Percentage of all workers in analytical occupations: 35.7%
- Concentration of workers in analytical occupations (compared to average): +5.6%
- Total workers in analytical occupations: 350,780
- Total workers in non-analytical occupations: 631,760

Photo Credit: AMB-MD Photography / Shutterstock
12. Minneapolis-St. Paul-Bloomington, MN-WI
- Percentage of all workers in analytical occupations: 35.8%
- Concentration of workers in analytical occupations (compared to average): +5.9%
- Total workers in analytical occupations: 652,220
- Total workers in non-analytical occupations: 1,170,700

Photo Credit: mahaloshine / Shutterstock
11. Seattle-Tacoma-Bellevue, WA
- Percentage of all workers in analytical occupations: 35.8%
- Concentration of workers in analytical occupations (compared to average): +5.9%
- Total workers in analytical occupations: 686,860
- Total workers in non-analytical occupations: 1,230,700

Photo Credit: Gang Liu / Shutterstock
10. Philadelphia-Camden-Wilmington, PA-NJ-DE-MD
- Percentage of all workers in analytical occupations: 36.2%
- Concentration of workers in analytical occupations (compared to average): +7.1%
- Total workers in analytical occupations: 961,200
- Total workers in non-analytical occupations: 1,693,480

Photo Credit: ESB Professional / Shutterstock
9. San Diego-Carlsbad, CA
- Percentage of all workers in analytical occupations: 36.3%
- Concentration of workers in analytical occupations (compared to average): +7.4%
- Total workers in analytical occupations: 505,230
- Total workers in non-analytical occupations: 885,180

Photo Credit: Roschetzky Photography / Shutterstock
8. Austin-Round Rock, TX
- Percentage of all workers in analytical occupations: 36.9%
- Concentration of workers in analytical occupations (compared to average): +9.2%
- Total workers in analytical occupations: 395,930
- Total workers in non-analytical occupations: 677,230

Photo Credit: Andrew Zarivny / Shutterstock
7. Denver-Aurora-Lakewood, CO
- Percentage of all workers in analytical occupations: 37.4%
- Concentration of workers in analytical occupations (compared to average): +10.7%
- Total workers in analytical occupations: 548,520
- Total workers in non-analytical occupations: 916,270

Photo Credit: Olivier Le Queinec / Shutterstock
6. Baltimore-Columbia-Towson, MD
- Percentage of all workers in analytical occupations: 38.0%
- Concentration of workers in analytical occupations (compared to average): +12.4%
- Total workers in analytical occupations: 477,120
- Total workers in non-analytical occupations: 778,650

Photo Credit: Jon Bilous / Shutterstock
5. Hartford-West Hartford-East Hartford, CT
- Percentage of all workers in analytical occupations: 38.4%
- Concentration of workers in analytical occupations (compared to average): +13.6%
- Total workers in analytical occupations: 208,780
- Total workers in non-analytical occupations: 335,600

Photo Credit: Pete Niesen / Shutterstock
4. San Francisco-Oakland-Hayward, CA
- Percentage of all workers in analytical occupations: 39.0%
- Concentration of workers in analytical occupations (compared to average): +15.4%
- Total workers in analytical occupations: 874,080
- Total workers in non-analytical occupations: 1,368,110
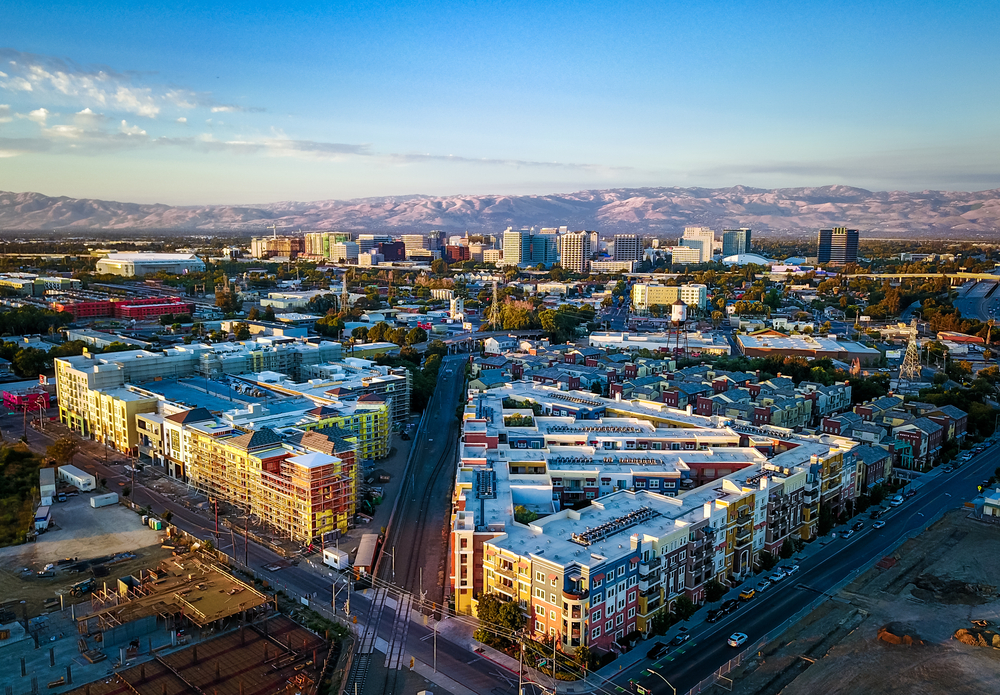
Photo Credit: Uladzik Kryhin / Shutterstock
3. San Jose-Sunnyvale-Santa Clara, CA
- Percentage of all workers in analytical occupations: 41.0%
- Concentration of workers in analytical occupations (compared to average): +21.3%
- Total workers in analytical occupations: 438,500
- Total workers in non-analytical occupations: 630,120

Photo Credit: Travellaggio / Shutterstock
2. Boston-Cambridge-Nashua, MA-NH
- Percentage of all workers in analytical occupations: 41.9%
- Concentration of workers in analytical occupations (compared to average): +24.0%
- Total workers in analytical occupations: 1,084,120
- Total workers in non-analytical occupations: 1,501,020

Photo Credit: Orhan Cam / Shutterstock
1. Washington-Arlington-Alexandria, DC-VA-MD-WV
- Percentage of all workers in analytical occupations: 46.1%
- Concentration of workers in analytical occupations (compared to average): +36.4%
- Total workers in analytical occupations: 1,351,890
- Total workers in non-analytical occupations: 1,580,710
Detailed Findings & Methodology
The data used in this analysis is from the U.S. Bureau of Labor Statistics Occupational Employment and Wage Statistics as well as O*NET Online’s Critical Thinking index. To determine the locations with the most analytical workers, researchers at Smartest Dollar calculated the percentage of all workers in analytical occupations-or occupations that rank in the top 50% for O*NET’s Critical Thinking index. In the event of a tie, the location with the greater total workers in analytical occupations was ranked higher. To improve relevance, only metropolitan areas with at least 100,000 residents were included, and metros were grouped into cohorts based on population size: small (100,000–349,999), midsize (350,000–999,999), and large (1,000,000 or more).
By clicking the above links, you will go to one of our insurance partners. The specific companies listed above may not be included in our partner's network at this time.