U.S. Cities With the Largest Employee-Manager Wage Gap [2023 Edition]
Despite widespread expectations of a recession in 2023, the U.S. labor market has continued to show signs of strength. The unemployment rate in the U.S. is at its lowest level in more than half a century, and the economy has added jobs every month since December 2020. Despite this, job openings remain higher than pre-pandemic levels, while labor force participation remains lower.
These conditions have been a benefit to many workers. Overall tightness in the market, exacerbated by record high job turnover in the Great Resignation, has allowed many workers to seek higher wages. Workers’ average expected salary offer has increased from $53,676 at the outset of the COVID-19 pandemic to $61,187 now. And much of the strongest wage growth has occurred among lower-income workers, helping them close the gap with higher earners.
RELATED
Employers frequently entice employees with additional perks, such as disability insurance and life insurance, on top of wage increases and improved healthcare coverage. These policies offer significant value and should be included when determining the total effective compensation package.
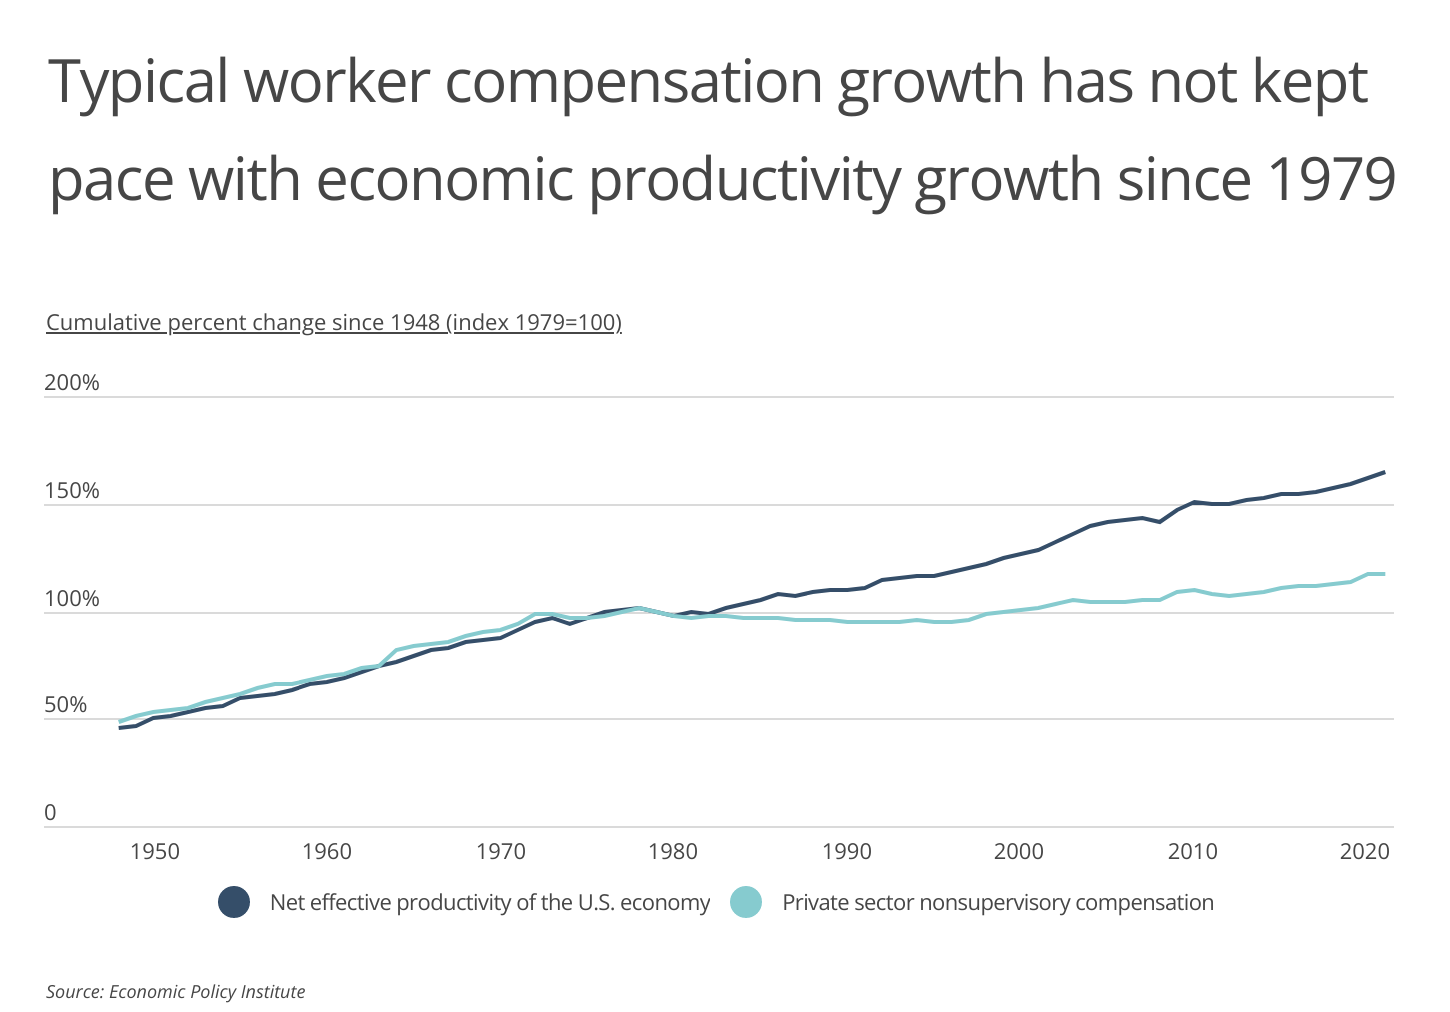
These trends stand in sharp contrast to what occurred over the last several decades. Since 1979, economic productivity in the U.S. increased significantly at the same time worker compensation growth lagged behind. While compensation for the typical nonsupervisory worker grew a modest 17.3% (after adjusting for inflation) during that time, overall economic productivity in the U.S. grew 64.6%. This significant difference suggests that while the economy continued to grow and become more productive, the average worker did not see a proportional increase in their compensation.
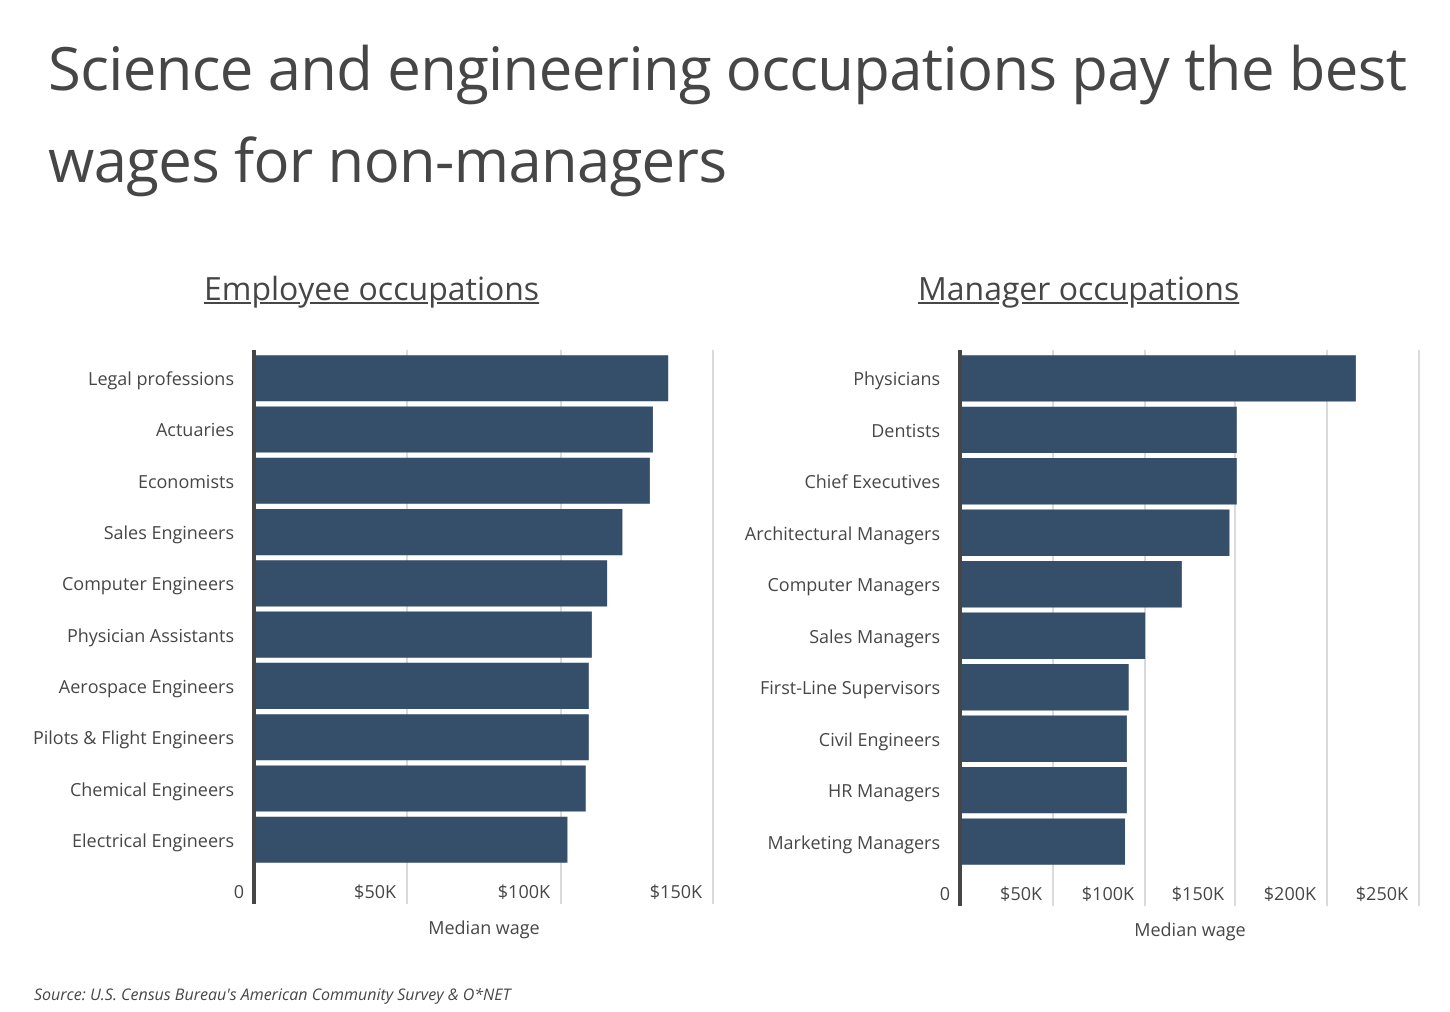
However, managers’ and employees’ earning prospects can vary significantly by industry. Many of the top-earning employee occupations have typical wages that exceed even higher-paying manager occupations. Lawyers, judges, magistrates, and judicial workers have the highest median wage for employee occupations at $135,000, higher than all but four of the top manager occupations. Most of the top-paying employee occupations are found in science and engineering professions, where typical workers earn six figures.
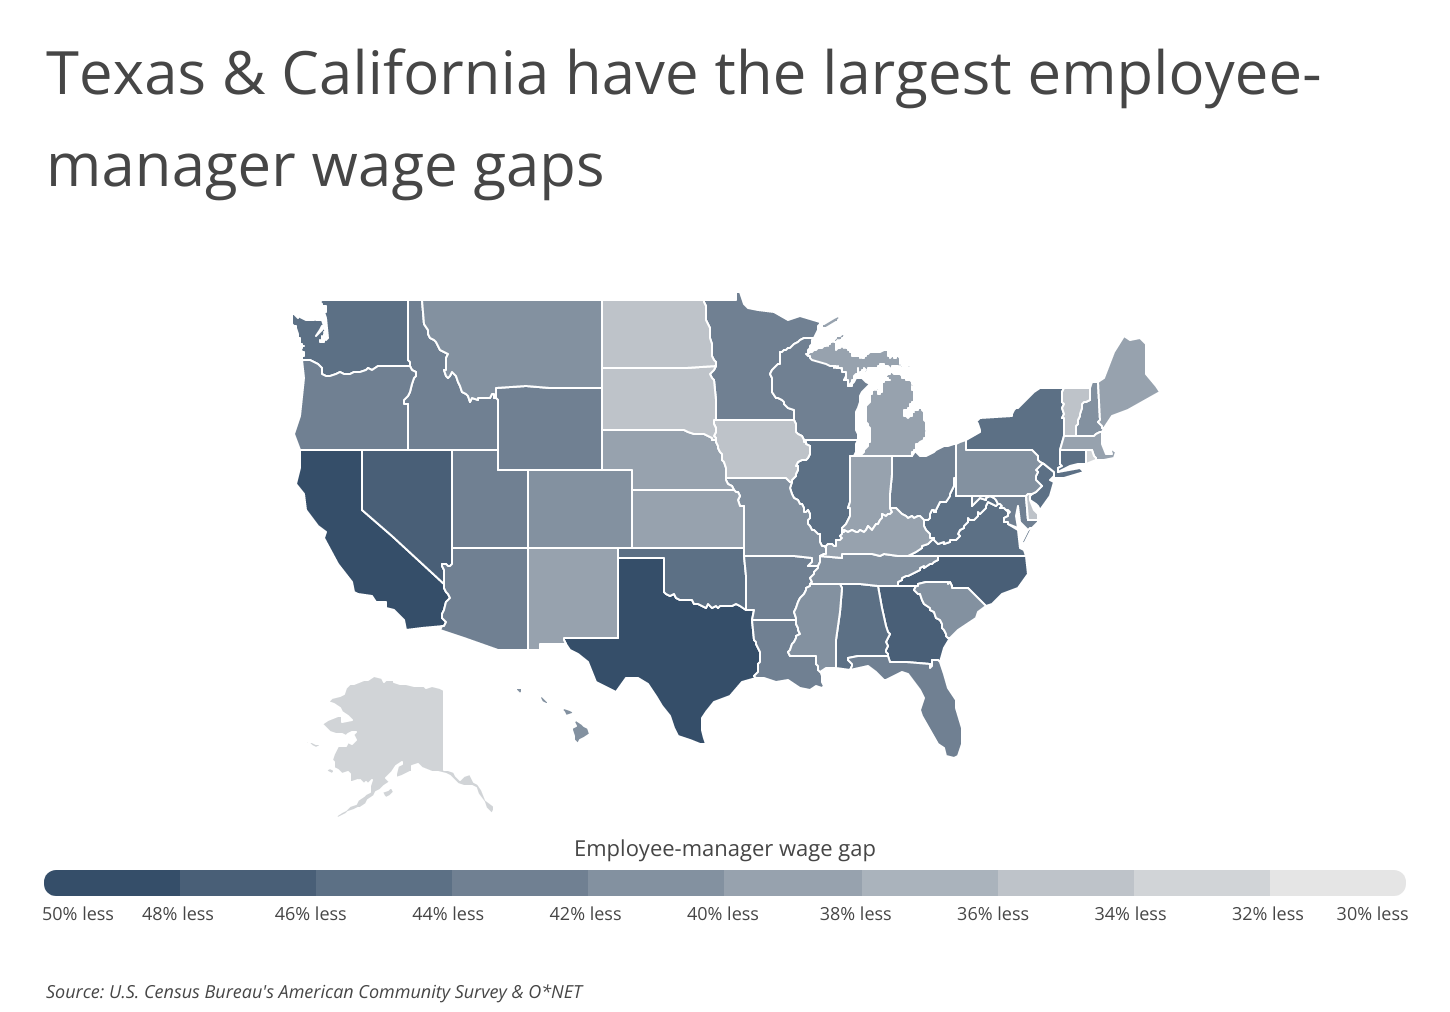
Differences between employees’ and managers’ wages also exist regionally. The gaps are largest in Texas and California, where the median manager earns approximately twice what the median employee does: 50.0% and 49.0%, respectively. Conversely, Alaska and Rhode Island both have a 33.3% employee-manager wage gap, which translates to employees making two-thirds of what their manager counterparts earn.
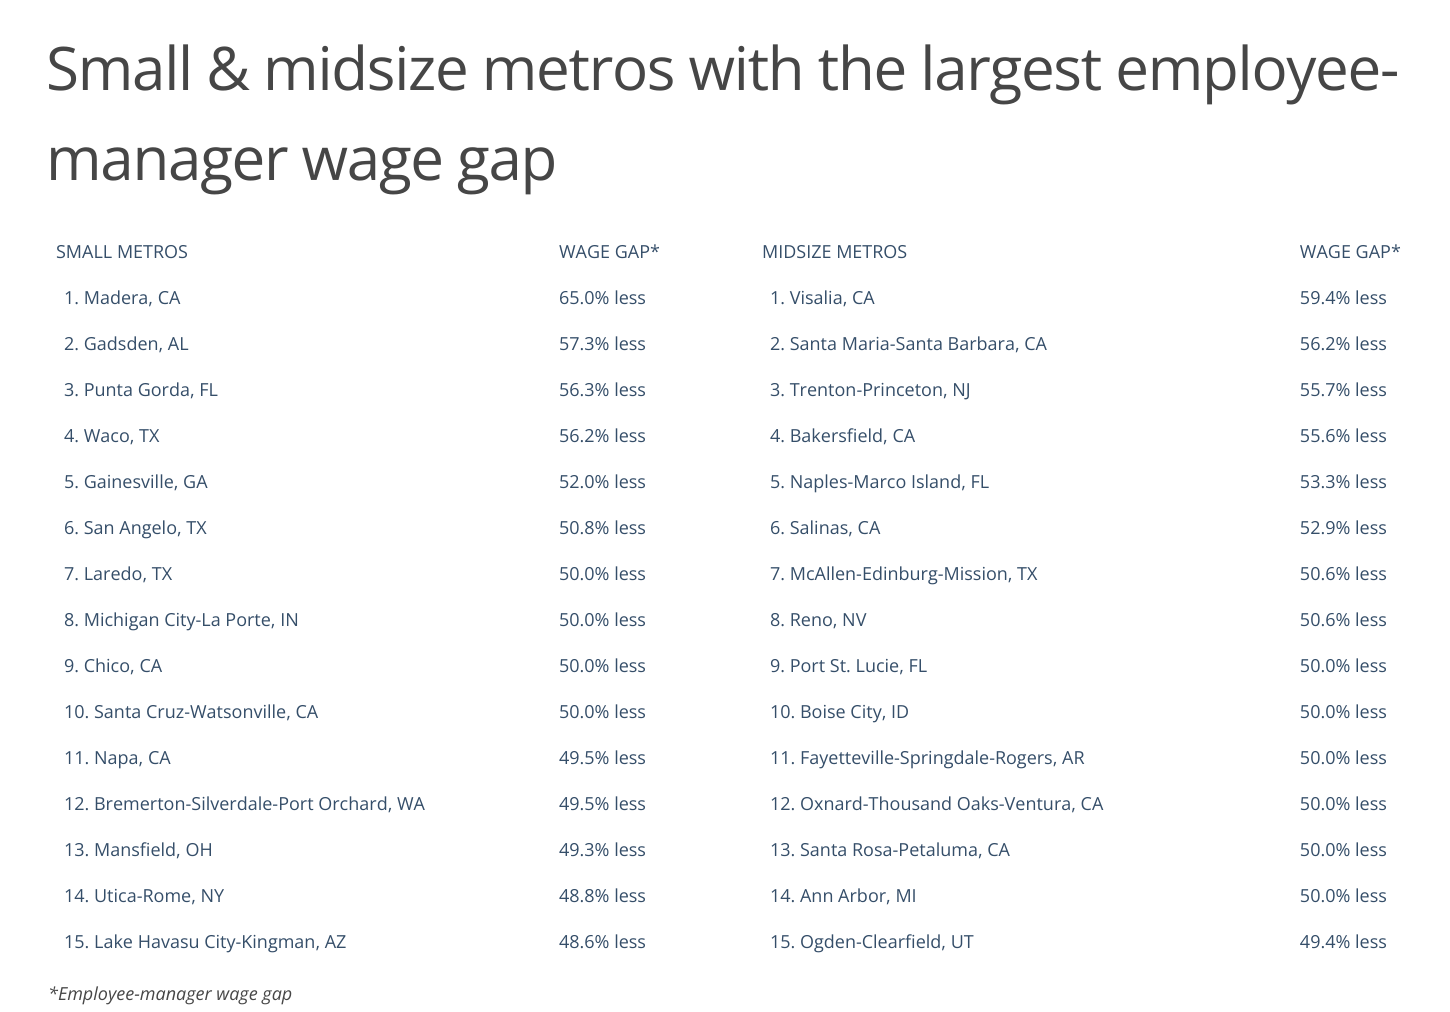
At the local level, California is home to many of the metropolitan markets where the difference between employee and manager wages is greatest. Each of the top three metros with the largest employee-manager wage gap nationwide are found in California, plus three others in the top 10. From high-wealth areas known for being home to major tech employers like San Jose and San Francisco, to lower-paying metros like Fresno and Riverside, employees throughout California find their wages trailing well behind managers’.
The data used in this analysis is from the U.S. Census Bureau as well as O*NET Online. To determine the locations with the largest employee-manager wage gap, researchers at Smartest Dollar calculated the percentage difference in median annual wages between employees and managers working full-time. Higher percentage differences indicate a greater disparity in wages between employees and managers. In the event of a tie, the location with the lower median annual wage for full-time employees was ranked higher.
Here are the U.S. metropolitan areas with the largest employee-manager wage gap.
Large Metros With the Largest Employee-Manager Wage Gap

Photo Credit: Henryk Sadura / Shutterstock
15. Tampa-St. Petersburg-Clearwater, FL
- Employee-manager wage gap: 45.3% less
- Median annual wage for full-time employees (non-manager): $41,000
- Median annual wage for full-time managers: $75,000
- Percentage of workers that are employees (non-manager): 76.1%
FOR BUSINESS OWNERS
Small businesses should consider obtaining professional liability insurance if they offer services and product liability insurance if they sell physical goods, in addition to any other legally mandated insurance coverage. These policies can prove to be crucial for protecting against potential liabilities.

Photo Credit: Sean Pavone / Shutterstock
14. Birmingham-Hoover, AL
- Employee-manager wage gap: 45.6% less
- Median annual wage for full-time employees (non-manager): $40,800
- Median annual wage for full-time managers: $75,000
- Percentage of workers that are employees (non-manager): 78.7%

Photo Credit: Sean Pavone / Shutterstock
13. Raleigh-Cary, NC
- Employee-manager wage gap: 45.7% less
- Median annual wage for full-time employees (non-manager): $50,000
- Median annual wage for full-time managers: $92,000
- Percentage of workers that are employees (non-manager): 70.0%

Photo Credit: Francisco Sandoval Guate / Shutterstock
12. Dallas-Fort Worth-Arlington, TX
- Employee-manager wage gap: 45.8% less
- Median annual wage for full-time employees (non-manager): $45,000
- Median annual wage for full-time managers: $83,000
- Percentage of workers that are employees (non-manager): 75.2%
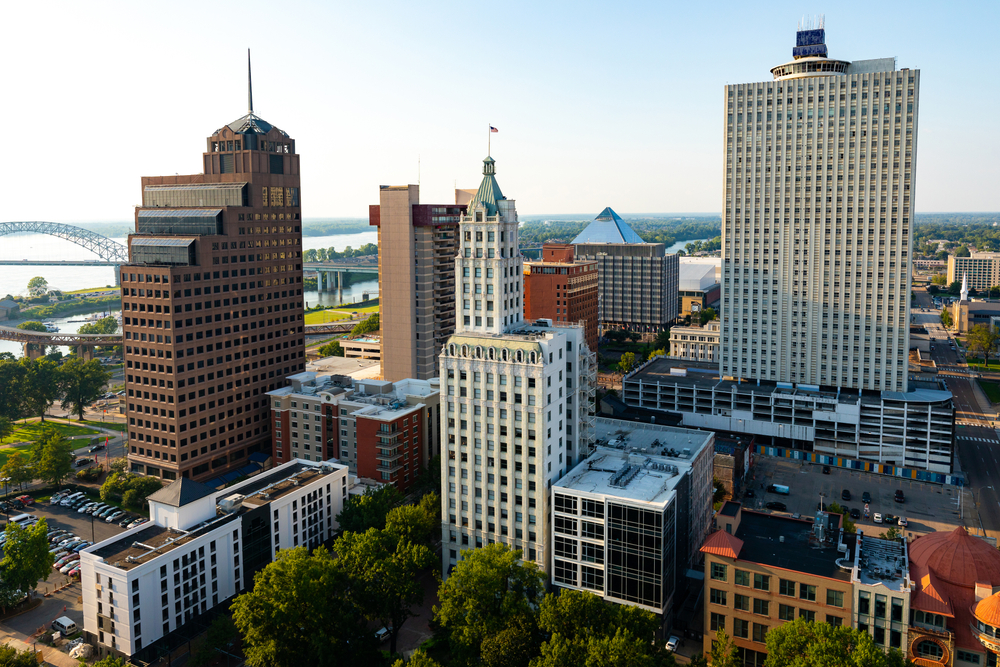
Photo Credit: Connor D. Ryan / Shutterstock
11. Memphis, TN-MS-AR
- Employee-manager wage gap: 45.9% less
- Median annual wage for full-time employees (non-manager): $40,000
- Median annual wage for full-time managers: $74,000
- Percentage of workers that are employees (non-manager): 79.9%

Photo Credit: Steve Heap / Shutterstock
10. Nashville-Davidson–Murfreesboro–Franklin, TN
- Employee-manager wage gap: 46.3% less
- Median annual wage for full-time employees (non-manager): $43,000
- Median annual wage for full-time managers: $80,000
- Percentage of workers that are employees (non-manager): 74.8%

Photo Credit: May Lana / Shutterstock
9. Miami-Fort Lauderdale-Pompano Beach, FL
- Employee-manager wage gap: 46.6% less
- Median annual wage for full-time employees (non-manager): $39,000
- Median annual wage for full-time managers: $73,000
- Percentage of workers that are employees (non-manager): 75.8%

Photo Credit: Steve Minkler / Shutterstock
8. Riverside-San Bernardino-Ontario, CA
- Employee-manager wage gap: 47.3% less
- Median annual wage for full-time employees (non-manager): $42,200
- Median annual wage for full-time managers: $80,000
- Percentage of workers that are employees (non-manager): 81.9%

Photo Credit: Sean Pavone / Shutterstock
7. San Diego-Chula Vista-Carlsbad, CA
- Employee-manager wage gap: 47.4% less
- Median annual wage for full-time employees (non-manager): $50,000
- Median annual wage for full-time managers: $95,000
- Percentage of workers that are employees (non-manager): 76.2%

Photo Credit: Chones / Shutterstock
6. Los Angeles-Long Beach-Anaheim, CA
- Employee-manager wage gap: 47.9% less
- Median annual wage for full-time employees (non-manager): $46,900
- Median annual wage for full-time managers: $90,000
- Percentage of workers that are employees (non-manager): 75.6%
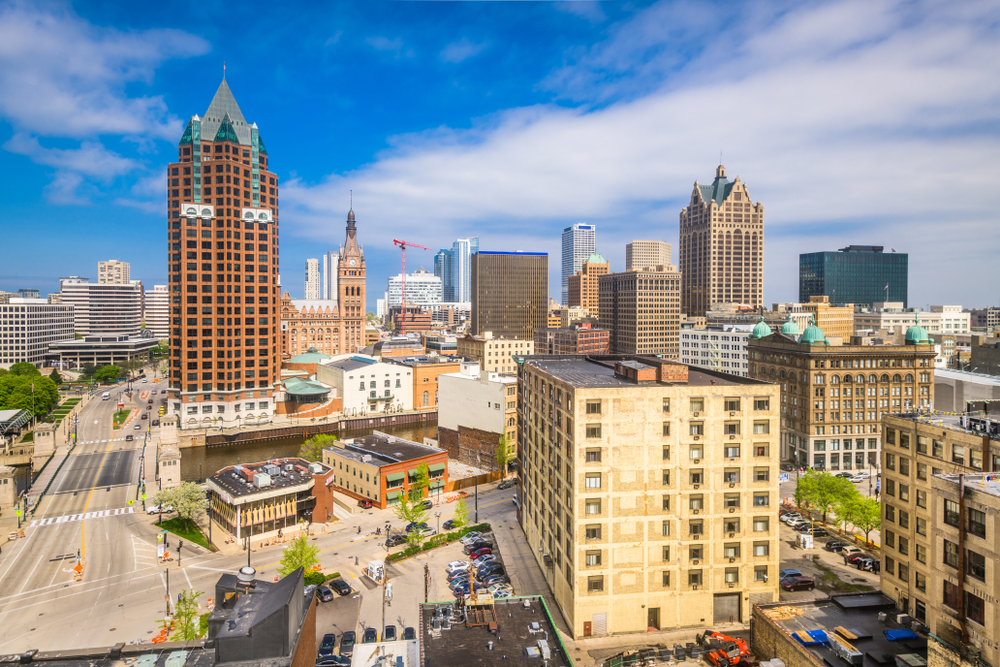
Photo Credit: Sean Pavone / Shutterstock
5. Milwaukee-Waukesha, WI
- Employee-manager wage gap: 48.0% less
- Median annual wage for full-time employees (non-manager): $46,800
- Median annual wage for full-time managers: $90,000
- Percentage of workers that are employees (non-manager): 76.7%

Photo Credit: Sean Pavone / Shutterstock
4. Houston-The Woodlands-Sugar Land, TX
- Employee-manager wage gap: 50.0% less
- Median annual wage for full-time employees (non-manager): $43,000
- Median annual wage for full-time managers: $86,000
- Percentage of workers that are employees (non-manager): 77.8%

Photo Credit: stellamc / Shutterstock
3. Fresno, CA
- Employee-manager wage gap: 50.0% less
- Median annual wage for full-time employees (non-manager): $40,000
- Median annual wage for full-time managers: $80,000
- Percentage of workers that are employees (non-manager): 81.0%

Photo Credit: yhelfman / Shutterstock
2. San Francisco-Oakland-Berkeley, CA
- Employee-manager wage gap: 52.9% less
- Median annual wage for full-time employees (non-manager): $66,000
- Median annual wage for full-time managers: $140,000
- Percentage of workers that are employees (non-manager): 70.9%

Photo Credit: Sundry Photography / Shutterstock
1. San Jose-Sunnyvale-Santa Clara, CA
- Employee-manager wage gap: 53.3% less
- Median annual wage for full-time employees (non-manager): $70,000
- Median annual wage for full-time managers: $150,000
- Percentage of workers that are employees (non-manager): 71.9%
Detailed Findings & Methodology
The data used in this analysis is from the U.S. Census Bureau’s 2021 American Community Survey as well as O*NET Online’s Management of Personnel Resources and Guiding, Directing, and Motivating Subordinates indexes. To determine the locations with the largest employee-manager wage gap, researchers at Smartest Dollar calculated the percentage difference in median annual wages between employees and managers working full-time. Higher percentage differences indicate a greater disparity in wages between employees and managers. In the event of a tie, the location with the lower median annual wage for full-time employees was ranked higher.
For the purpose of this analysis, manager occupations were defined as those that rank in the top 10% in Importance rating for both the Management of Personnel Resources index and Guiding, Directing, and Motivating Subordinates index. Employee occupations were defined as those that rank in the bottom 75% in Importance rating for those same indexes. To improve relevance, only metropolitan areas with at least 100,000 residents were included. Additionally, metros were grouped into cohorts based on population size: small (100,000–349,999), midsize (350,000–999,999), and large (1,000,000 or more).
By clicking the above links, you will go to one of our insurance partners. The specific companies listed above may not be included in our partner's network at this time.