U.S. Cities With the Largest Renter Wage Gaps [2021 Edition]
The expiration of the CDC’s national eviction moratorium on July 31 brought new attention to how the pandemic has put pressure on the housing market. With the expiration of the moratorium, millions of renters now face the possibility of eviction from overdue rent payments, after being protected from displacement for more than a year due to the economic and public health crisis.
The economic situation since the pandemic began has been acutely difficult for many renters. Many of the people who have been most likely to lose jobs or wages during the pandemic are also more likely to rent than to own their homes. Meanwhile, COVID-19 has driven housing prices higher for renters and home buyers alike due to high demand and low supply. As a result, the typical renter has less to spend on housing that is becoming more expensive.
But the pandemic has only accelerated trends that have already been underway in the U.S. rental market for years. According to a recent report by the National Low Income Housing Coalition, median gross rents increased faster than median rental household income between 2001 and 2018 in 45 states and D.C.
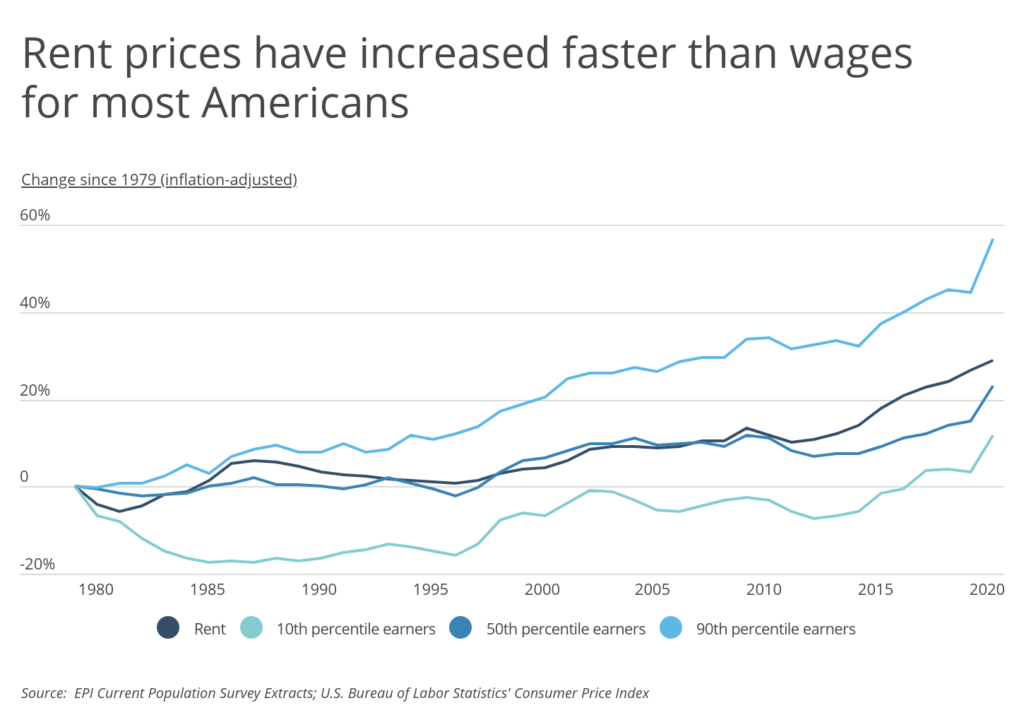
This reality is even more stark when looking at different income levels. Since 1979, the wage growth of 90th percentile earners in the U.S. (the nation’s highest-paid workers) has consistently outpaced rents, while 50th percentile earnings more or less kept pace with rents before falling slightly behind after the last recession. For 10th percentile earners, however, inflation-adjusted wage growth was not only lower than the growth rate for rents over the last 40 years, it was also negative from 1979 to 2017.
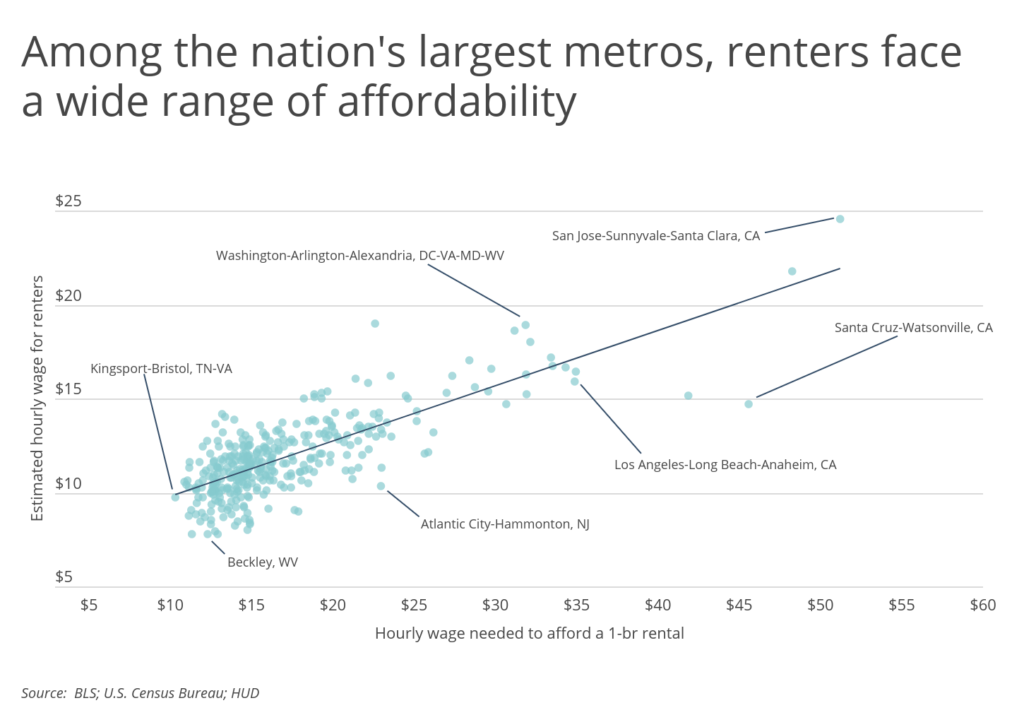
A combination of data from the U.S. Department of Housing and Urban Development (HUD), the Bureau of Labor Statistics (BLS), and the Census Bureau indicates that full-time workers today would need to earn nearly $21 per hour to afford a median-priced one-bedroom apartment without spending more than 30% of their income on rent. Meanwhile, the estimated hourly wage for renters nationwide is just over $13 and the federal minimum wage has been locked in at $7.25 since 2009.
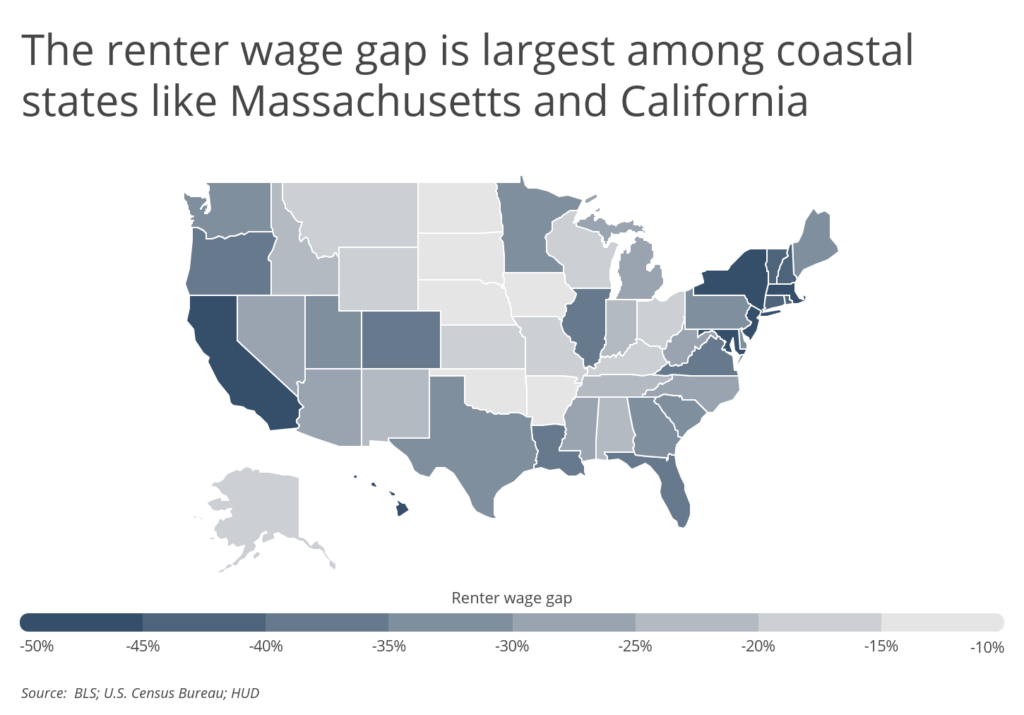
And the gap between actual wages and what’s needed to afford a typical one-bedroom apartment is larger in places where rent is more expensive than normal. This is particularly true in states like Massachusetts, California, New Jersey, and Hawaii, where housing supply is harder to build for geographic or policy reasons. In states like these, the average renter would need to approximately double their hourly earnings to be able to afford rental housing at current rates.
At the metro level, many of the same affordability challenges persist as well. The estimated hourly wage for renters exceeds the wage needed to afford a one-bedroom rental in only seven major metro areas with more than 100,000 residents, all of which have extremely low costs of living. At the other end of the spectrum, the renter wage gap can exceed $25 or even $30 per hour.
TRENDING
With the rise of the gig economy, more people have become their own bosses. Unfortunately, many of these new business owners are underinsured. That’s why Smartest Dollar put together a list of the best small business insurance companies for a wide range of use cases.
To identify the areas with the largest renter wage gaps, researchers at Smartest Dollar analyzed the latest data from HUD, the BLS, and the U.S. Census Bureau. Researchers used this data to calculate the gap between renters’ actual (estimated) wages and the wages they need to make in order to afford the median rent for a one-bedroom rental in each location. The renter wage gap was calculated with the assumption that the renter works full time and does not spend any more than 30% of his or her gross income on rent.
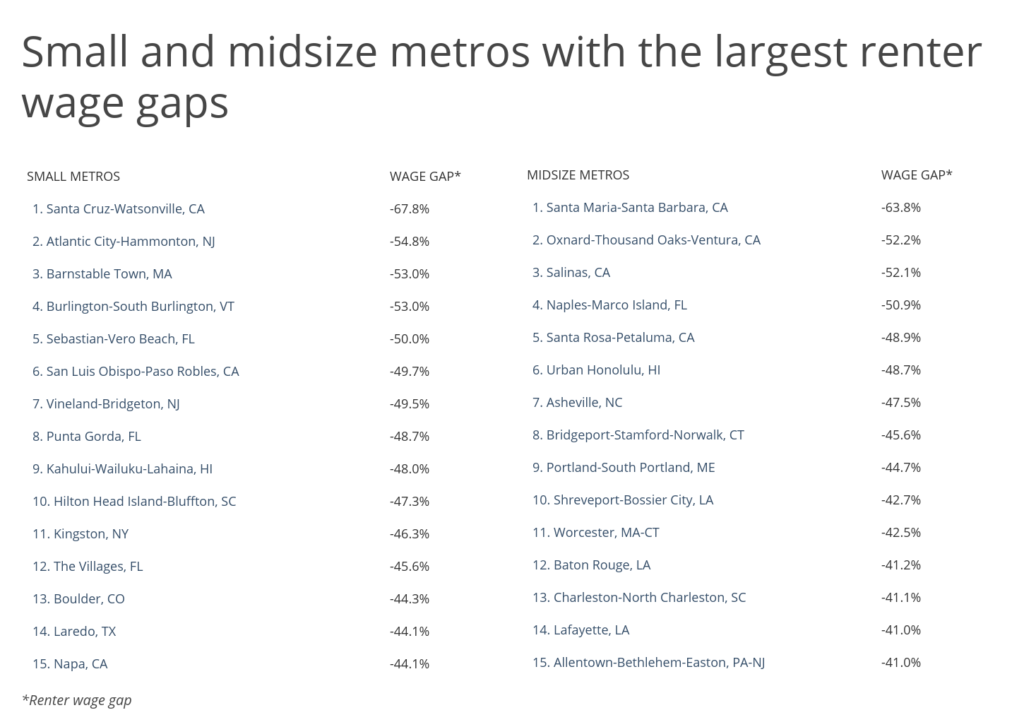
Here are the U.S. metropolitan areas with the largest renter wage gaps.
Large Metros With the Largest Renter Wage Gaps

Photo Credit: Sean Pavone / Shutterstock
15. Birmingham-Hoover, AL
- Renter wage gap: -41.3%
- Median 1-br rent: $939
- Hourly wage needed to afford a 1-br rental: $18.07
- Estimated hourly wage for renters: $10.61
- Share of households that are renter-occupied: 32.3%
TRENDING
If you have family members or other individuals that depend on you, it’s important to be protected financially should something tragic occur. The best life insurance companies will provide financial protection for your family for a reasonable monthly premium.

Photo Credit: Richard Cavalleri / Shutterstock
14. Providence-Warwick, RI-MA
- Renter wage gap: -41.4%
- Median 1-br rent: $1,031
- Hourly wage needed to afford a 1-br rental: $19.82
- Estimated hourly wage for renters: $11.60
- Share of households that are renter-occupied: 38.0%

Photo Credit: Felix Mizioznikov / Shutterstock
13. Chicago-Naperville-Elgin, IL-IN-WI
- Renter wage gap: -42.7%
- Median 1-br rent: $1,178
- Hourly wage needed to afford a 1-br rental: $22.66
- Estimated hourly wage for renters: $12.98
- Share of households that are renter-occupied: 35.6%

Photo Credit: Sean Pavone / Shutterstock
12. Austin-Round Rock-Georgetown, TX
- Renter wage gap: -43.0%
- Median 1-br rent: $1,309
- Hourly wage needed to afford a 1-br rental: $25.17
- Estimated hourly wage for renters: $14.34
- Share of households that are renter-occupied: 42.4%

Photo Credit: Jon Bilous / Shutterstock
11. Riverside-San Bernardino-Ontario, CA
- Renter wage gap: -43.1%
- Median 1-br rent: $1,199
- Hourly wage needed to afford a 1-br rental: $23.06
- Estimated hourly wage for renters: $13.3
- Share of households that are renter-occupied: 36.1%

Photo Credit: Bob Pool / Shutterstock
10. Portland-Vancouver-Hillsboro, OR-WA
- Renter wage gap: -43.3%
- Median 1-br rent: $1,404
- Hourly wage needed to afford a 1-br rental: $27.00
- Estimated hourly wage for renters: $15.30
- Share of households that are renter-occupied: 38.2%

Photo Credit: Farid Sani / Shutterstock
9. Raleigh-Cary, NC
- Renter wage gap: -44.9%
- Median 1-br rent: $1,134
- Hourly wage needed to afford a 1-br rental: $21.81
- Estimated hourly wage for renters: $12.01
- Share of households that are renter-occupied: 34.4%
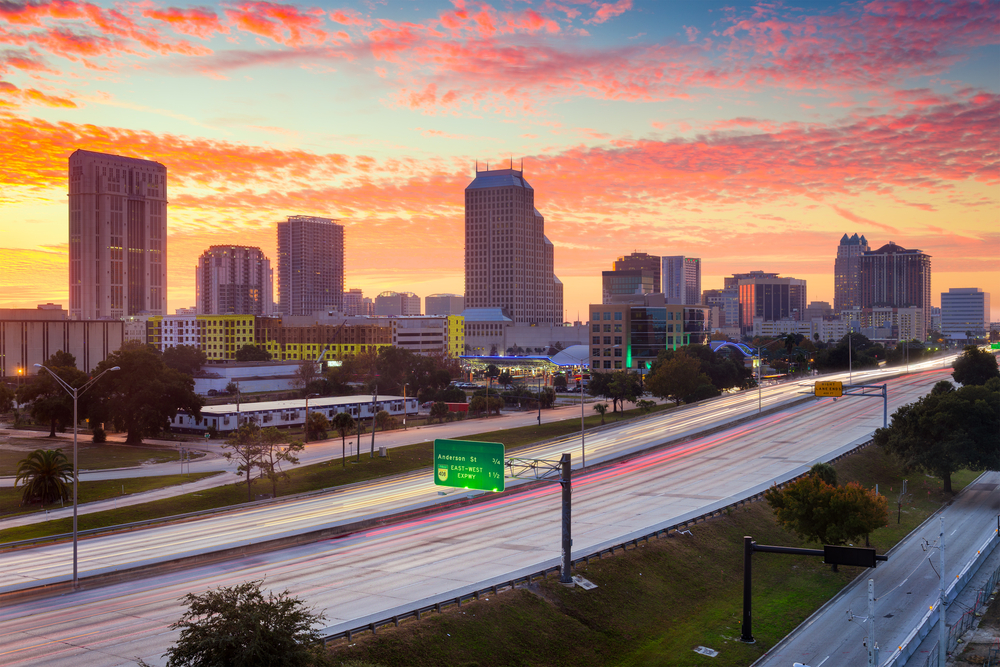
Photo Credit: Sean Pavone / Shutterstock
8. Orlando-Kissimmee-Sanford, FL
- Renter wage gap: -45.2%
- Median 1-br rent: $1,227
- Hourly wage needed to afford a 1-br rental: $23.60
- Estimated hourly wage for renters: $12.94
- Share of households that are renter-occupied: 38.1%
TRENDING
Millennials-the nation’s largest generation-now make over 60% of their purchases online. For individuals or businesses selling these products, it’s critical to have the appropriate insurance should an accident happen involving a customer. Even for businesses that exclusively sell online, product liability insurance will cover claims related to the product once it reaches the customer.
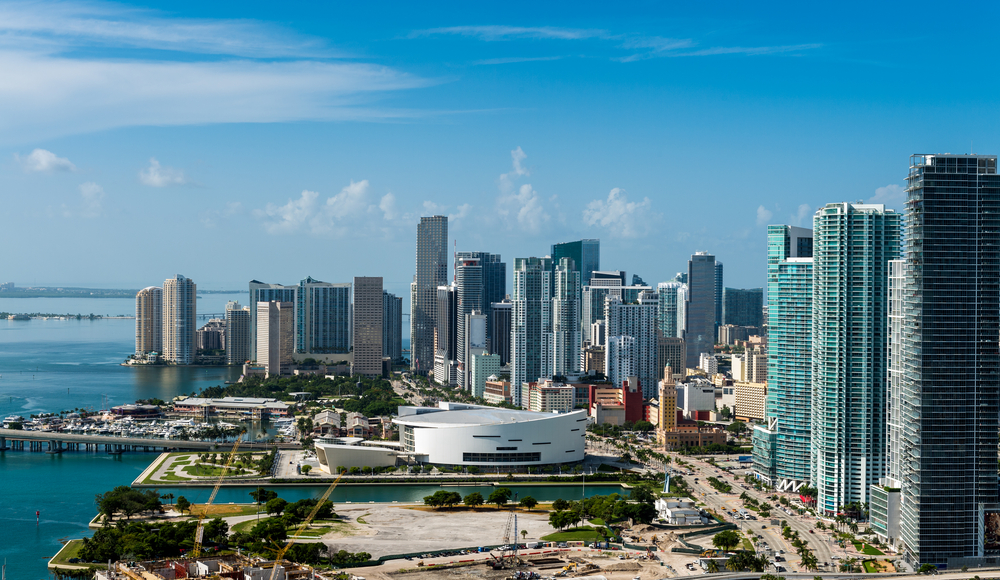
Photo Credit: Daniel Korzeniewski / Shutterstock
7. Miami-Fort Lauderdale-Pompano Beach, FL
- Renter wage gap: -45.2%
- Median 1-br rent: $1,308
- Hourly wage needed to afford a 1-br rental: $25.16
- Estimated hourly wage for renters: $13.80
- Share of households that are renter-occupied: 40.8%

Photo Credit: Sean Pavone / Shutterstock
6. San Diego-Chula Vista-Carlsbad, CA
- Renter wage gap: -50.2%
- Median 1-br rent: $1,743
- Hourly wage needed to afford a 1-br rental: $33.52
- Estimated hourly wage for renters: $16.71
- Share of households that are renter-occupied: 46.2%

Photo Credit: Sean Pavone / Shutterstock
5. New York-Newark-Jersey City, NY-NJ-PA
- Renter wage gap: -51.6%
- Median 1-br rent: $1,784
- Hourly wage needed to afford a 1-br rental: $34.32
- Estimated hourly wage for renters: $16.62
- Share of households that are renter-occupied: 49.2%

Photo Credit: Uladzik Kryhin / Shutterstock
4. San Jose-Sunnyvale-Santa Clara, CA
- Renter wage gap: -52.0%
- Median 1-br rent: $2,663
- Hourly wage needed to afford a 1-br rental: $51.21
- Estimated hourly wage for renters: $24.57
- Share of households that are renter-occupied: 44.8%

Photo Credit: Travellaggio / Shutterstock
3. Boston-Cambridge-Newton, MA-NH
- Renter wage gap: -53.0%
- Median 1-br rent: $1,817
- Hourly wage needed to afford a 1-br rental: $34.95
- Estimated hourly wage for renters: $16.42
- Share of households that are renter-occupied: 38.5%

Photo Credit: Sean Pavone / Shutterstock
2. Los Angeles-Long Beach-Anaheim, CA
- Renter wage gap: -54.5%
- Median 1-br rent: $1,814
- Hourly wage needed to afford a 1-br rental: $34.88
- Estimated hourly wage for renters: $15.88
- Share of households that are renter-occupied: 51.8%

Photo Credit: f11photo / Shutterstock
1. San Francisco-Oakland-Berkeley, CA
- Renter wage gap: -54.9%
- Median 1-br rent: $2,510
- Hourly wage needed to afford a 1-br rental: $48.26
- Estimated hourly wage for renters: $21.77
- Share of households that are renter-occupied: 46.0%
Methodology & Detailed Findings
The renter wage gap-or the gap between renters’ actual (estimated) wages and the wages they need to make in order to afford the median rent for a one-bedroom rental-was calculated with the assumption that the renter works full time and does not spend any more than 30% of his or her gross income on rent.
Monthly rental prices for each location were sourced from HUD’s 50th Percentile Rent Estimates 2021. The prices shown are for one-bedroom apartments. An estimate for the hourly wage needed to afford a one-bedroom rental was calculated using median rent prices. To calculate the estimated hourly wage for renters, median hourly wages were sourced from the BLS’s most recent Occupational Employment and Wage Statistics (OEWS) dataset. These wages were adjusted by the ratio of renter household income to overall household income using figures from the U.S. Census Bureau latest American Community Survey (ACS) to determine the wage estimates for renters specifically. The share of households that are renter-occupied was also determined using data from the ACS.
To improve relevance, only metros with at least 100,000 residents were included in the analysis. Metros were also grouped into the following cohorts based on population size: small (100,000–349,999); midsize (350,000–999,999); and large (1,000,000 or more).
By clicking the above links, you will go to one of our insurance partners. The specific companies listed above may not be included in our partner's network at this time.