U.S. Cities With the Highest Loan Approval Rates [2021 Edition]
Pent-up demand from the pandemic, low interest rates, and a shortage of properties have created a booming housing market with near record levels of refinance activity. While typical home values have increased by 15% from a year ago, the housing market is expected to stay hot in many cities through the end of the year and into next. According to the most recent loan-level mortgage data from the Home Mortgage Disclosure Act, there were 12.1 million mortgage loan applications approved in 2020 with an overall approval rate of 83.6%.
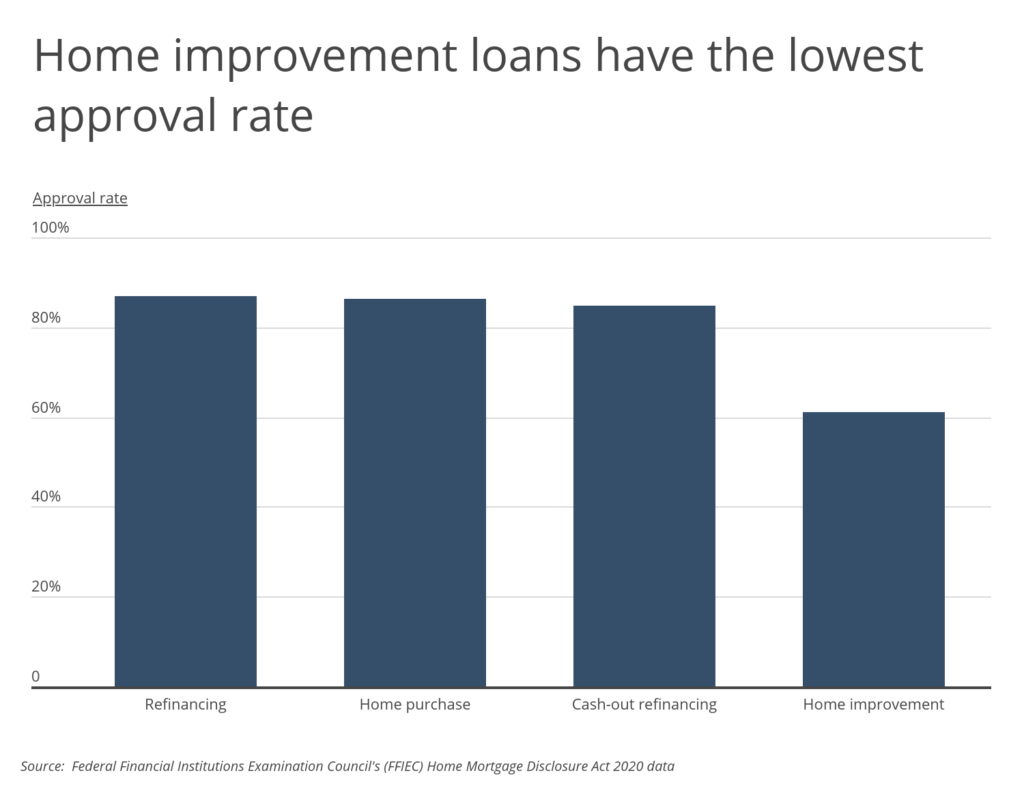
Mortgage loan approval rates vary by purpose of the loan. Refinancing applications for conventional, single-family loans without a cash-out option, had the highest approval rate, at 86.9%. Home purchase loans had a nearly identical approval rate at 86.3%, and cash-out refinancing applications were just slightly less likely to be approved, with an approval rate of 84.9%. In comparison to these types of loans, home improvement loans were the least likely to be approved-just 61% of home improvement loans were approved in 2020.
RELATED
As increasingly more people operate businesses out of their homes, it’s important for them to have the right insurance. Smartest Dollar helps small businesses and individuals find the best insurance policies for their specific needs. For more information, see our updated guide on finding the best small business insurance companies.
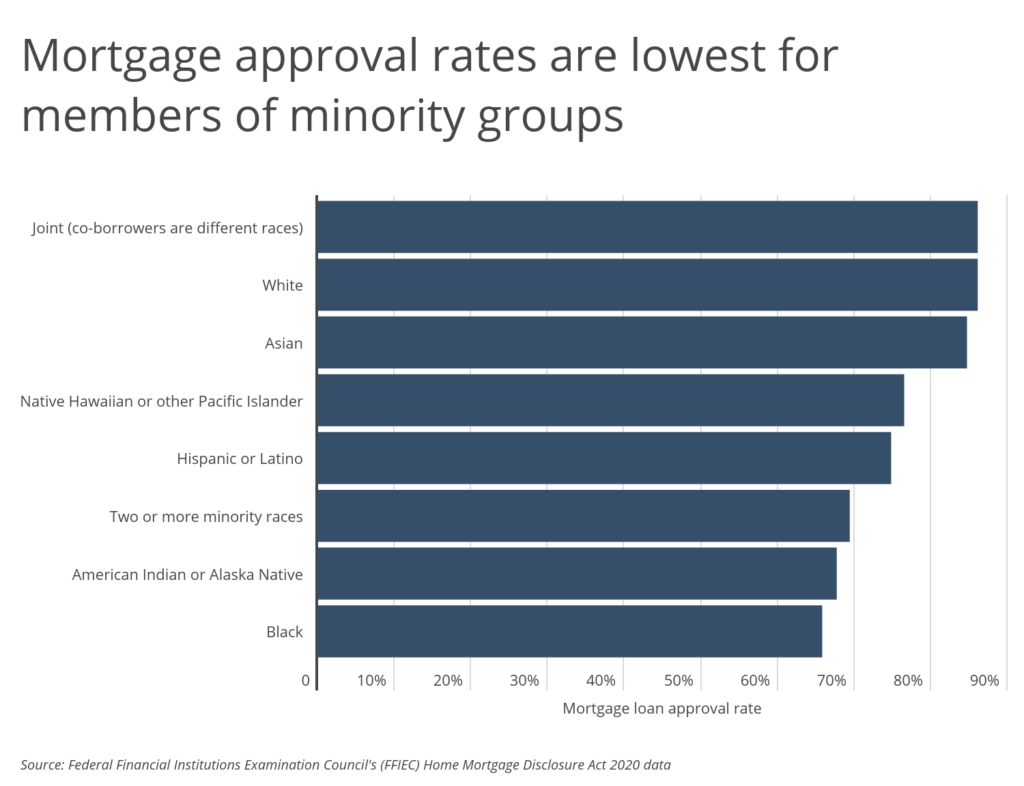
Mortgage application approval rates vary not only by purpose of the loan but also by demographic characteristics of the applicant, including race and ethnicity. Co-applicants of different races (“joint”) and non-Hispanic white applicants had the highest loan approval rates, both at 86.1%. Black, American Indian or Alaskan Native, and applicants of two or more minority races experienced the lowest approval rates, ranging from 65.8% to 69.4%. The loan approval rate for Hispanic or Latino applicants was 74.8%-a figure higher than that of other minority groups, but still 11 percentage points below the approval rate of white borrowers.
Differences in loan approval rates are in part due to varying credit profiles and application types across racial and ethnic groups. Members of minority groups are more likely to have lower incomes, lower credit scores, and live in economically disadvantaged neighborhoods. Still, research points to persistent discrimination in the lending market, and that even controlling for differences in financial health, minorities are denied loans at higher rates than their white counterparts.
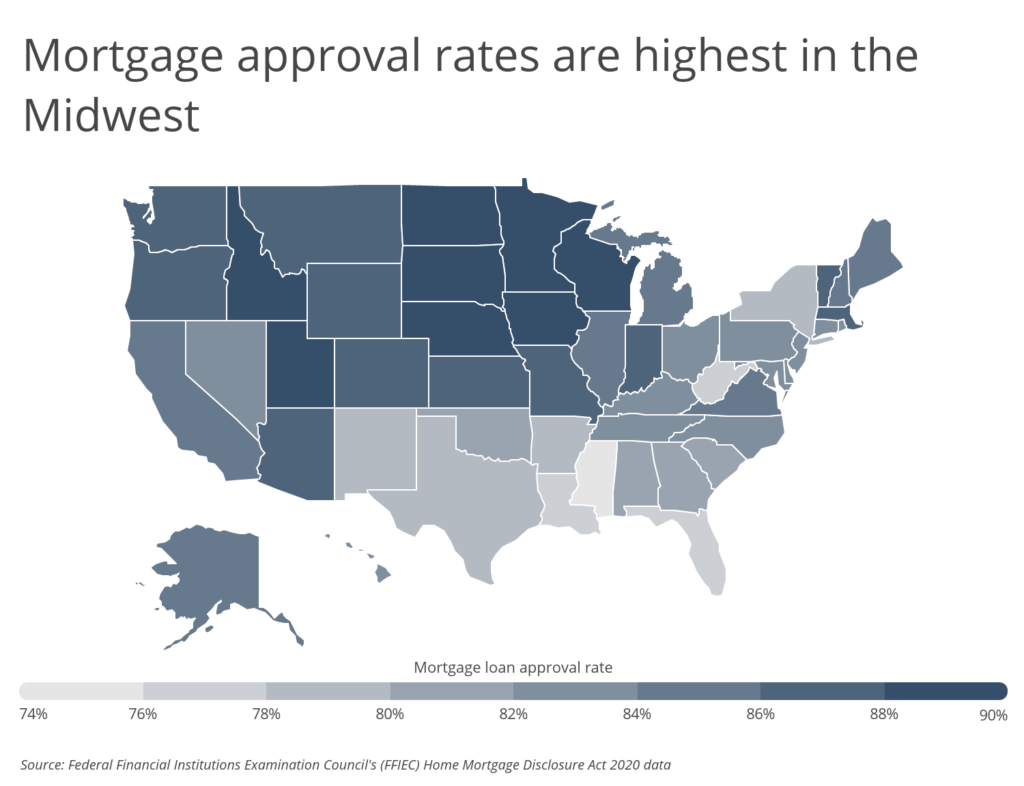
Approval rates are highest in the Midwest, while they tend to be lower in the South and Southeast. This is likely due to differences in local demographic makeup and socioeconomic status. At 90.6% and 90.1%, respectively, North Dakota and South Dakota residents experienced the highest loan approval rates in the country. At the other end of the spectrum, Mississippi and Florida residents faced the lowest loan approval rates, at just 74.7% and 77.1%, respectively.
To find the locations with the highest loan approval rates, researchers at Smartest Dollar analyzed the latest data from the Federal Financial Institutions Examination Council’s Home Mortgage Disclosure Act, the U.S. Census Bureau, and Zillow. The researchers ranked metros according to the mortgage loan approval rate. Researchers also calculated the total loan applications approved, median home price, median household income, and minority population share-defined as the percentage of the population that is not non-Hispanic white.
To improve relevance, only metropolitan areas with at least 100,000 people were included in the analysis. Additionally, metro areas were grouped into the following cohorts based on population size:
- Small metros: 100,000–349,999
- Midsize metros: 350,000–999,999
- Large metros: 1,000,000 or more
Here are the metros with the highest loan approval rates.
Large Metros With the Highest Loan Approval Rates

Photo Credit: Gregory E. Clifford / Shutterstock
15. Phoenix-Mesa-Chandler, AZ
- Mortgage loan approval rate: 86.9%
- Total loan applications approved: 299,785
- Median home price: $367,484
- Median household income: $67,896
- Minority population share: 45.5%
RELATED
Smartest Dollar helps small businesses find the right insurance for their needs. From product liability insurance and tow truck insurance to life insurance, our research team has you covered.

Photo Credit: Farid Sani / Shutterstock
14. Raleigh-Cary, NC
- Mortgage loan approval rate: 87.2%
- Total loan applications approved: 81,117
- Median home price: $333,255
- Median household income: $80,096
- Minority population share: 39.3%

Photo Credit: Sean Pavone / Shutterstock
13. Milwaukee-Waukesha, WI
- Mortgage loan approval rate: 87.4%
- Total loan applications approved: 78,032
- Median home price: $237,009
- Median household income: $65,845
- Minority population share: 34.1%
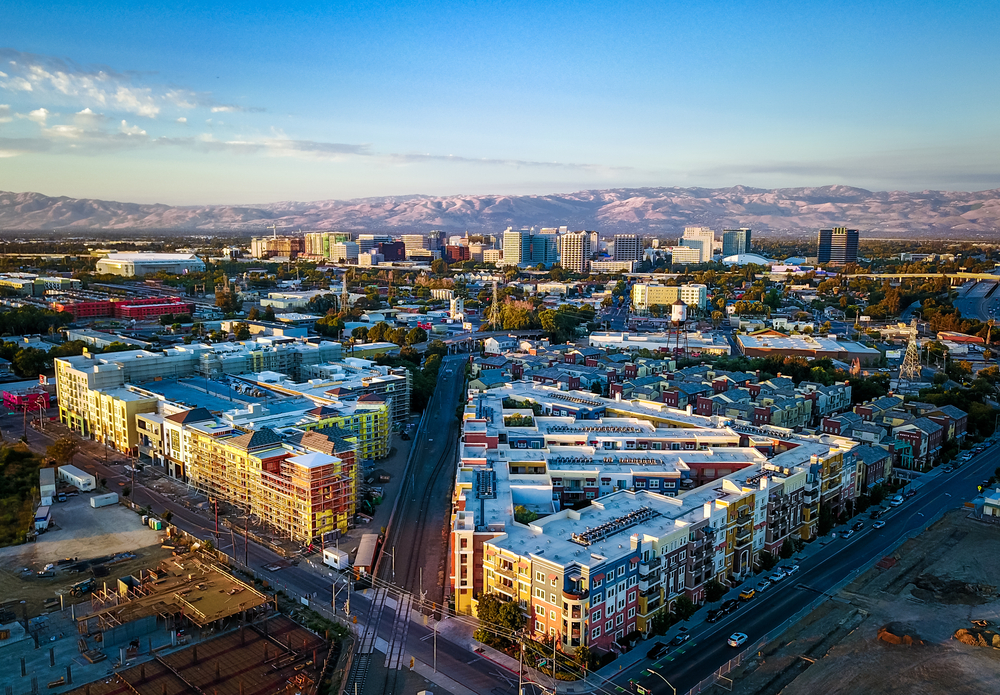
Photo Credit: Uladzik Kryhin / Shutterstock
12. San Jose-Sunnyvale-Santa Clara, CA
- Mortgage loan approval rate: 87.4%
- Total loan applications approved: 106,692
- Median home price: $1,384,778
- Median household income: $130,865
- Minority population share: 69.5%

Photo Credit: Travellaggio / Shutterstock
11. Boston-Cambridge-Newton, MA-NH
- Mortgage loan approval rate: 87.4%
- Total loan applications approved: 240,213
- Median home price: $573,182
- Median household income: $94,430
- Minority population share: 30.8%

Photo Credit: Andriy Blokhin / Shutterstock
10. Sacramento-Roseville-Folsom, CA
- Mortgage loan approval rate: 87.6%
- Total loan applications approved: 141,741
- Median home price: $516,489
- Median household income: $76,706
- Minority population share: 48.7%

Photo Credit: Nicholas Courtney / Shutterstock
9. Denver-Aurora-Lakewood, CO
- Mortgage loan approval rate: 87.7%
- Total loan applications approved: 226,051
- Median home price: $529,969
- Median household income: $85,641
- Minority population share: 36.5%

Photo Credit: Photosbykaity / Shutterstock
8. Grand Rapids-Kentwood, MI
- Mortgage loan approval rate: 87.8%
- Total loan applications approved: 55,182
- Median home price: $260,442
- Median household income: $65,739
- Minority population share: 22.1%

Photo Credit: Agnieszka Gaul / Shutterstock
7. Indianapolis-Carmel-Anderson, IN
- Mortgage loan approval rate: 87.8%
- Total loan applications approved: 102,323
- Median home price: $216,944
- Median household income: $62,502
- Minority population share: 28.7%

Photo Credit: Checubus / Shutterstock
6. Seattle-Tacoma-Bellevue, WA
- Mortgage loan approval rate: 87.8%
- Total loan applications approved: 249,869
- Median home price: $632,585
- Median household income: $94,027
- Minority population share: 38.3%

Photo Credit: f11photo / Shutterstock
5. Kansas City, MO-KS
- Mortgage loan approval rate: 87.9%
- Total loan applications approved: 91,428
- Median home price: $244,048
- Median household income: $70,215
- Minority population share: 28.0%

Photo Credit: Maciej Bledowski / Shutterstock
4. Salt Lake City, UT
- Mortgage loan approval rate: 88.0%
- Total loan applications approved: 91,754
- Median home price: $486,928
- Median household income: $80,196
- Minority population share: 29.2%

Photo Credit: Bob Pool / Shutterstock
3. Portland-Vancouver-Hillsboro, OR-WA
- Mortgage loan approval rate: 88.3%
- Total loan applications approved: 150,164
- Median home price: $496,162
- Median household income: $78,439
- Minority population share: 27.7%

Photo Credit: Sean Pavone / Shutterstock
2. St. Louis, MO-IL
- Mortgage loan approval rate: 88.4%
- Total loan applications approved: 126,136
- Median home price: $209,683
- Median household income: $66,417
- Minority population share: 26.6%

Photo Credit: Checubus / Shutterstock
1. Minneapolis-St. Paul-Bloomington, MN-WI
- Mortgage loan approval rate: 89.3%
- Total loan applications approved: 208,558
- Median home price: $337,255
- Median household income: $83,698
- Minority population share: 25.4%
Detailed Findings & Methodology
The large metros with the highest loan approval rates are mostly located in the Midwest and West and have approval rates ranging from 86.9% to 89.3%. While median home prices vary widely across the large metros with the highest approval rates-from a low of $210,000 to nearly $1.4 million-median household income skews higher than the national median of $66,000. With the exception of Phoenix, San Jose, and Sacramento, minority population percentages are lower than the national level of 40%.
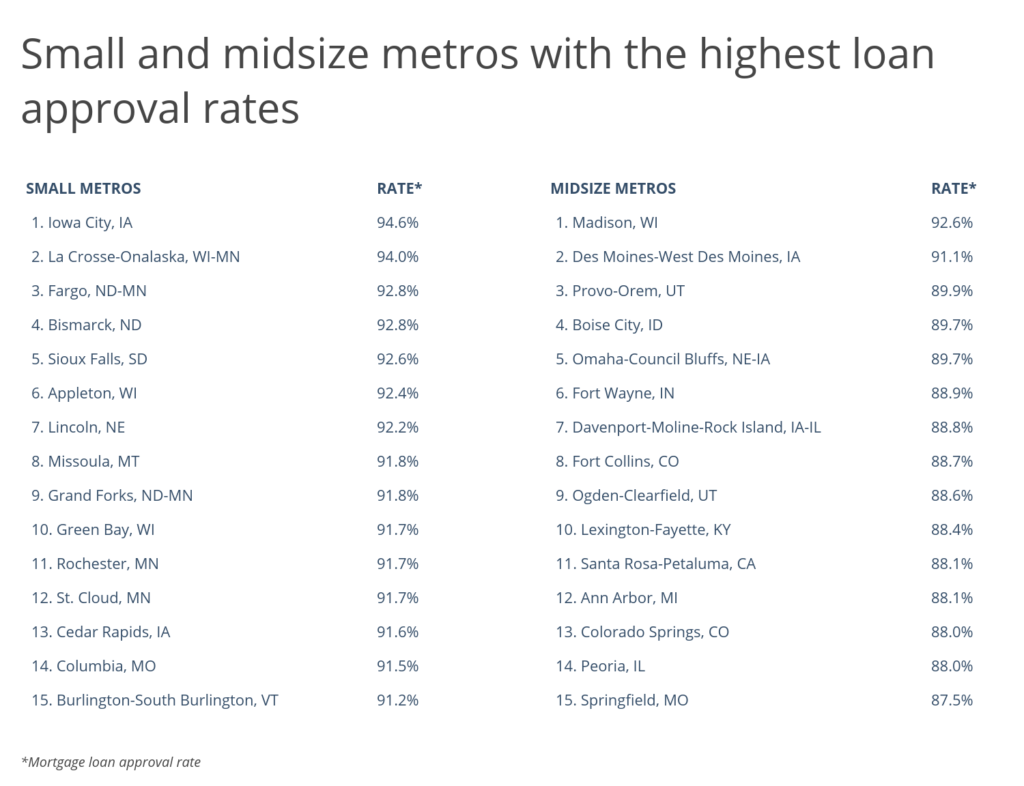
The small and midsize metros with the highest loan approval rates are also mostly spread across the Midwest and West. Loan approval rates in these cities are as high as 94%. Median home prices and median household income in some of these metros are lower than the national level; however, all of these metros have smaller-than-average minority populations.
To find the locations with the highest loan approval rates, researchers at Smartest Dollar analyzed the latest data from the Federal Financial Institutions Examination Council’s Home Mortgage Disclosure Act, the U.S. Census Bureau’s 2019 American Community Survey, and Zillow’s Zillow Home Value Index. The researchers ranked metros according to the mortgage loan approval rate. In the event of a tie, the metro with the larger number of mortgage loan approvals was ranked higher. Researchers also calculated median home price, median household income, and minority population share-defined as the percentage of the population that is not non-Hispanic white.
Only conventional, single-family mortgage applications were considered in the analysis. In the calculation of approval rates, withdrawn and incomplete applications as well as purchased loans were excluded.
To improve relevance, only metropolitan areas with at least 100,000 people were included in the analysis. Additionally, metro areas were grouped into the following cohorts based on population size:
- Small metros: 100,000–349,999
- Midsize metros: 350,000–999,999
- Large metros: 1,000,000 or more
By clicking the above links, you will go to one of our insurance partners. The specific companies listed above may not be included in our partner's network at this time.