U.S. States With the Most Temp Workers [2023 Edition]
Temporary workers play an important role in the U.S. economy. They can help fill in for employees who go on family leave, vacations, and sabbaticals while also allowing employers to evaluate potential employees without the long-term commitment. Temp workers can be employed directly by the company they perform services for, but are more typically employed by a staffing agency and deployed to a client to supplement their workforce for limited periods of time.
Staffing agencies often handle some of the prescreening, logistics, and training that can be expensive and tedious to do in-house. Additionally, employers who use temporary workers can also adjust their headcount quickly and respond to fluctuations in workload, allowing businesses the flexibility to match the ups and downs of the business cycle.
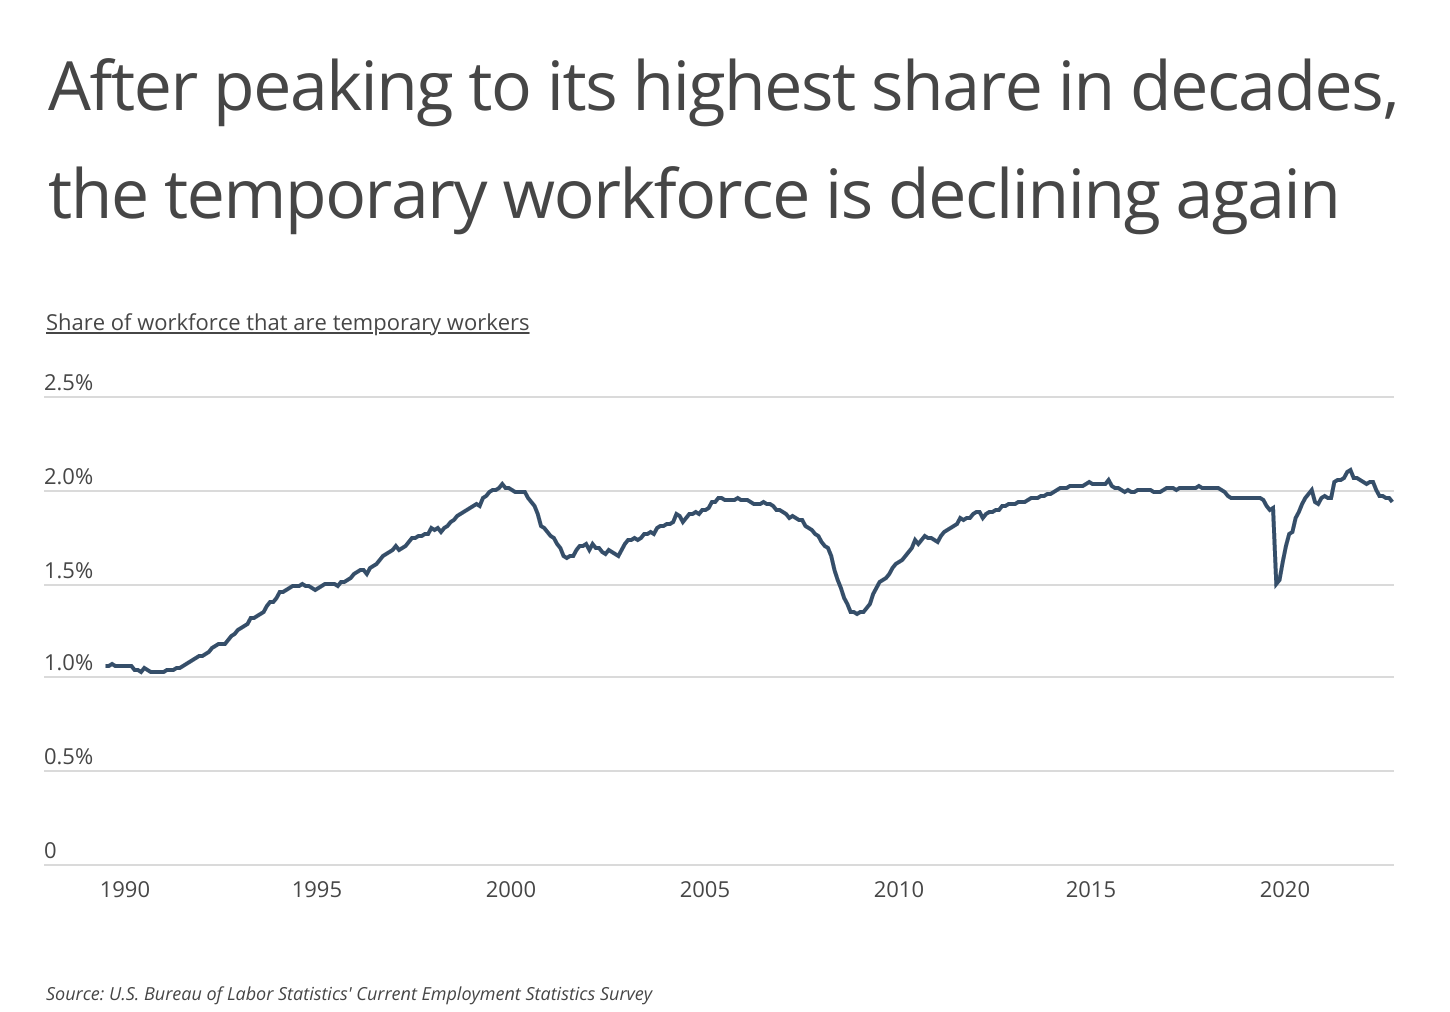
Perhaps more importantly, employment of temporary workers can act as a bellwether for overall employment. According to the U.S. Bureau of Labor Statistics, during periods of economic expansion, employers are able to ramp up quickly using temp workers before permanent hires can be made. Conversely, during economic contractions, firms will typically scale back their temporary workforce before reducing their core staff. Notably, a decline in the temporary workforce preceded both the 2001 recession and the Great Recession that began in late 2007.
In March of 2022, temporary workers made up 2.10% of the workforce, the highest share in decades. But since then, the percentage of temporary workers has fallen steadily, and in April 2023, temporary workers accounted for 1.93% of the workforce. The sustained decline in the current temporary workforce could be a sign that broader job losses and a potential recession are on the horizon.
FOR BUSINESS OWNERS
Insurers offer a variety of coverages that provide small businesses with protection from liability claims. To help you find the policies that meet your small business needs, we’ve put together insurance guides on the most popular coverages, including:
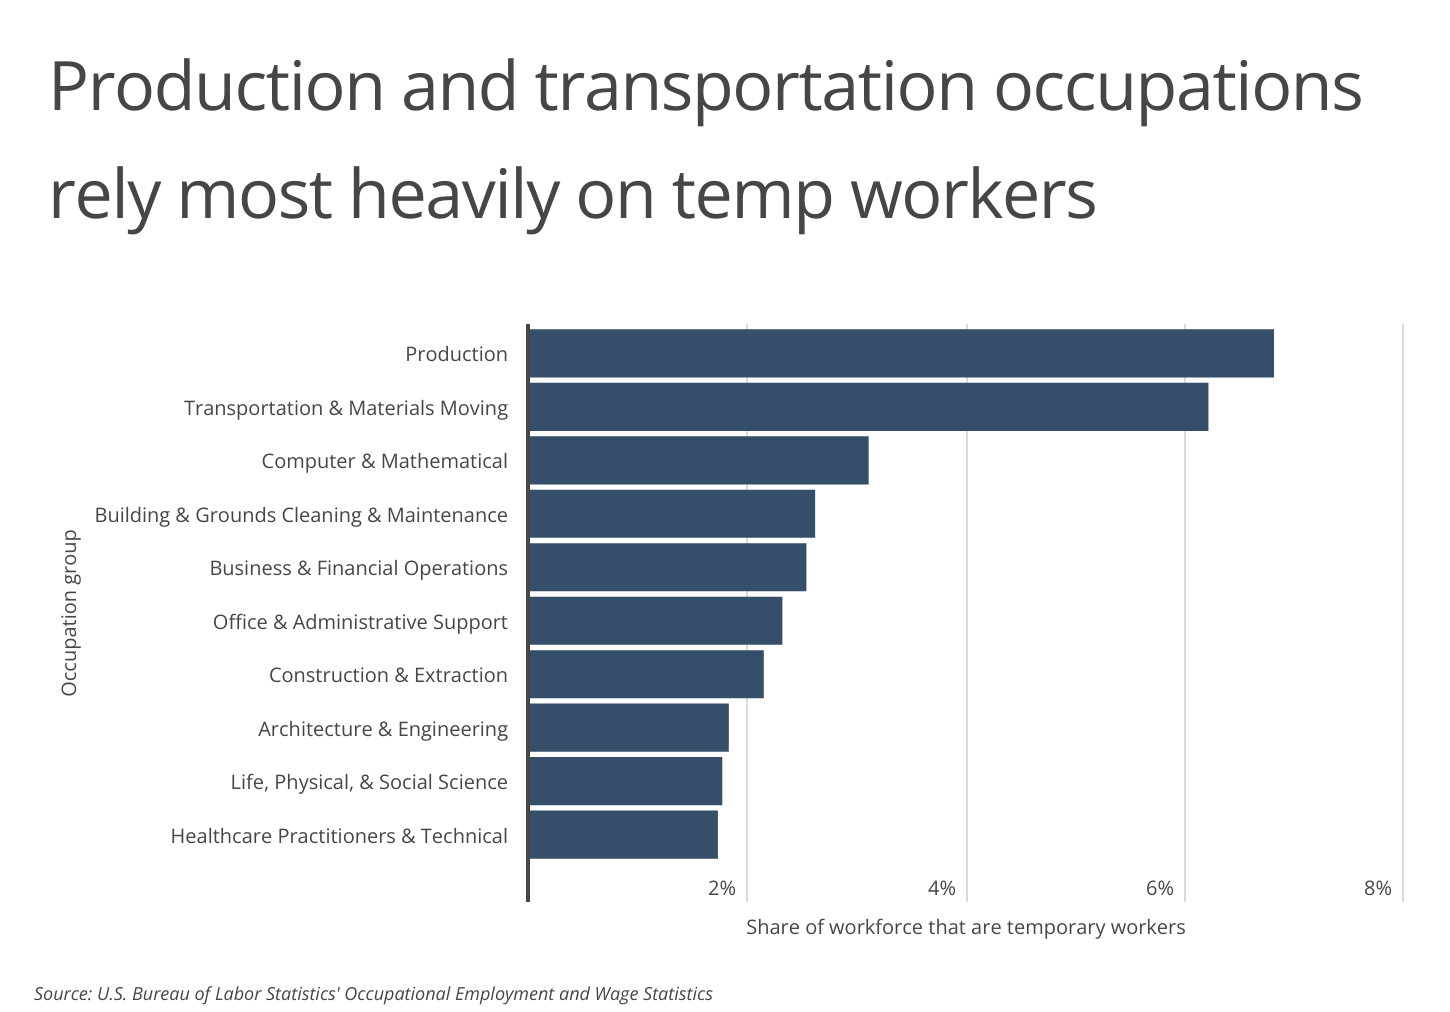
If the expectations of a pending recession are proven true, the industries and occupations that rely heavily on temporary workers could soon scale back their temporary workforces in anticipation of economic uncertainty. In particular, temporary workers in production occupations-many of which are in the manufacturing industry-and transportation and materials moving occupations each account for over 6% of the overall workforce. Companies often hire temporary production workers and delivery drivers to manage the ebb and flow of demand, and as demand falls, so will temporary labor.
DID YOU KNOW?
Small businesses entering into contracts with new or bigger clients may require you to have a certain amount of liability coverage. Supplementing your business’ insurance coverage with commercial umbrella insurance is often cheaper than increasing your underlying policy limits and can be a great option for meeting those requirements.
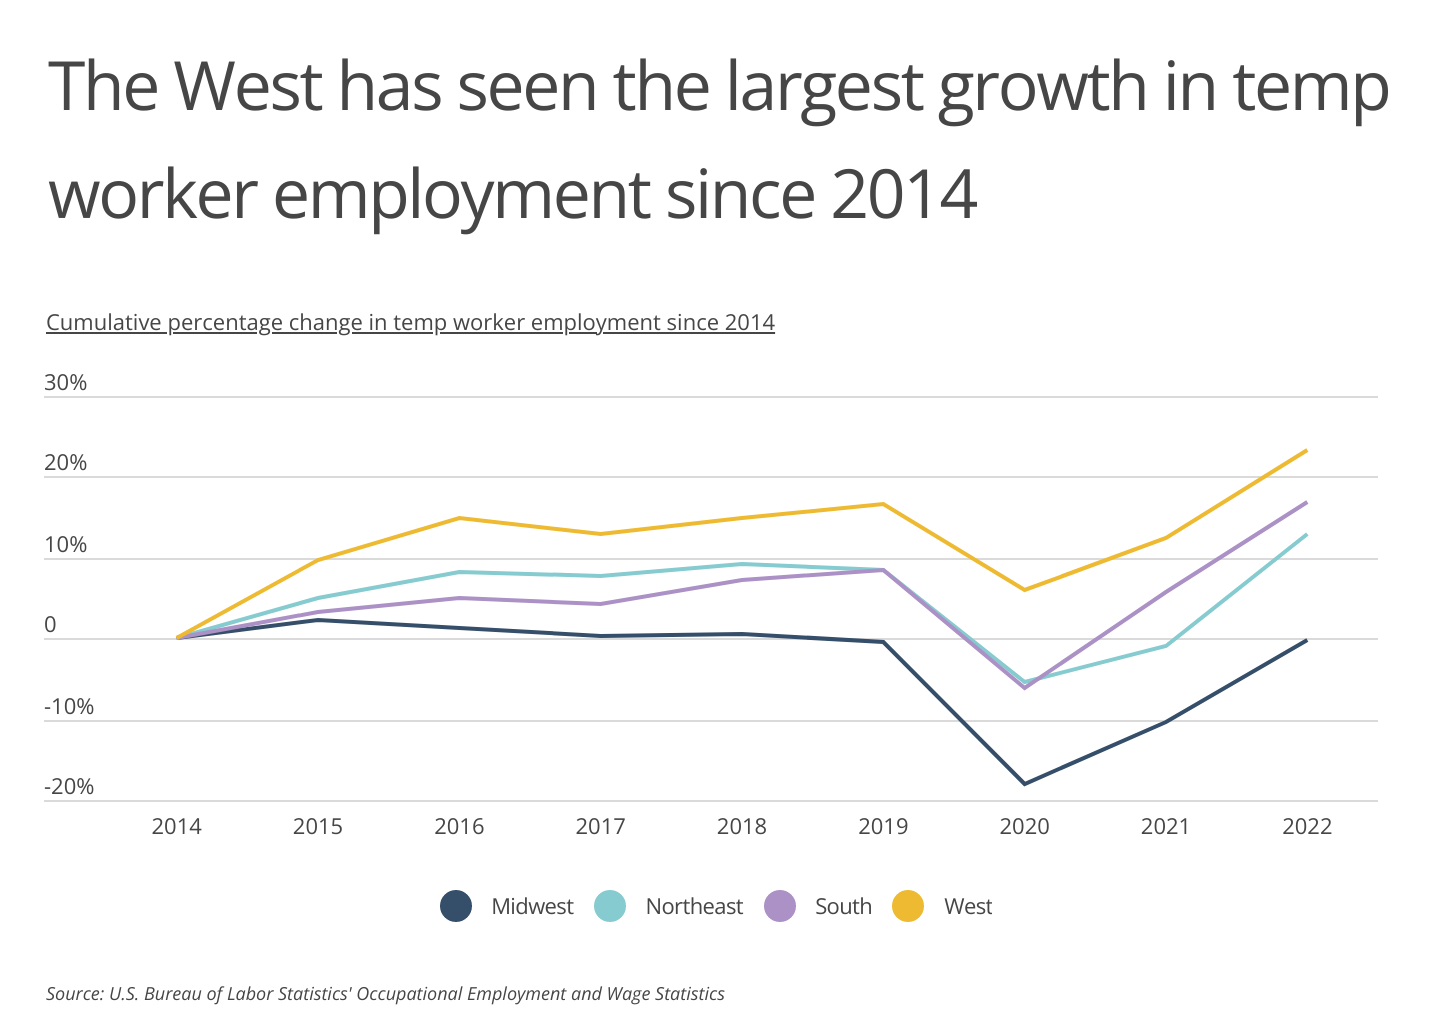
Temporary workers are more common in certain parts of the country, in part due to their overrepresentation in some industries and occupations. The Midwest has historically had the largest share of temp workers, partly because of a large manufacturing presence in the region. However, the West has experienced a 23.4% increase in temp workers since 2014, more than any other region in the country. The tech industry-which is highly concentrated in the western U.S.-has a long history of utilizing temp workers to fuel their operations. Growth in this sector likely contributed to the growing demand for temp workers in the West. Even in 2020 during the pandemic-when widespread layoffs were commonplace across the country-the share of temporary workers in the West was nearly 6% higher than it was in 2014.
Dependence on temporary workers varies at the state level as well. To determine the states with the most temp workers, researchers at Smartest Dollar analyzed employment data from the U.S. Bureau of Labor Statistics. The researchers ranked states according to the share of the workforce that are temporary workers. Researchers also calculated the total number of temporary workers, the percentage of all workers that are full time and part time, and the local unemployment rate for all workers.
Here are the states with the largest share of temporary workers.
States With the Largest Share of Temporary Workers

Photo Credit: Sean Pavone / Shutterstock
15. Ohio
- Share of workforce that are temporary workers: 2.2%
- Total temporary workers: 122,280
- Percentage of all workers that are full time: 80.6%
- Percentage of all workers that are part time: 19.3%
- Unemployment rate for all workers: 4.0%

Photo Credit: Sean Pavone / Shutterstock
14. Texas
- Share of workforce that are temporary workers: 2.2%
- Total temporary workers: 292,130
- Percentage of all workers that are full time: 84.9%
- Percentage of all workers that are part time: 15.0%
- Unemployment rate for all workers: 3.9%
Photo Credit: Mihai Andritoiu / Shutterstock
13. Delaware
- Share of workforce that are temporary workers: 2.3%
- Total temporary workers: 10,600
- Percentage of all workers that are full time: 84.9%
- Percentage of all workers that are part time: 15.0%
- Unemployment rate for all workers: 4.5%

Photo Credit: Sean Pavone / Shutterstock
12. California
- Share of workforce that are temporary workers: 2.3%
- Total temporary workers: 407,500
- Percentage of all workers that are full time: 82.2%
- Percentage of all workers that are part time: 17.7%
- Unemployment rate for all workers: 4.2%

Photo Credit: Sean Pavone / Shutterstock
11. Mississippi
- Share of workforce that are temporary workers: 2.5%
- Total temporary workers: 28,930
- Percentage of all workers that are full time: 87.0%
- Percentage of all workers that are part time: 12.9%
- Unemployment rate for all workers: 3.9%

Photo Credit: f11photo / Shutterstock
10. Michigan
- Share of workforce that are temporary workers: 2.5%
- Total temporary workers: 108,420
- Percentage of all workers that are full time: 81.4%
- Percentage of all workers that are part time: 18.5%
- Unemployment rate for all workers: 4.2%
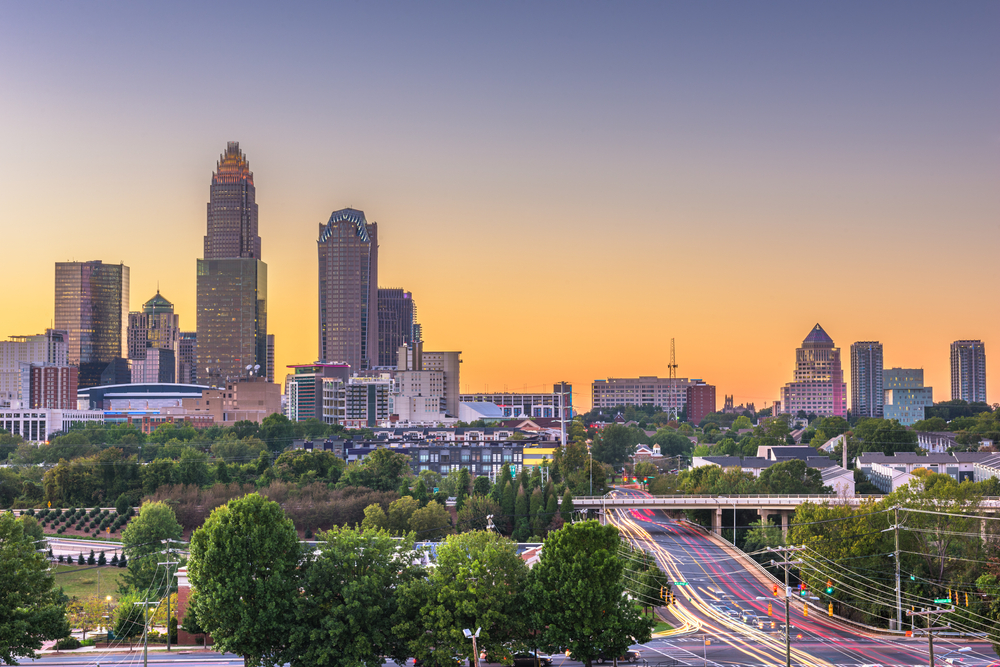
Photo Credit: Sean Pavone / Shutterstock
9. North Carolina
- Share of workforce that are temporary workers: 2.6%
- Total temporary workers: 121,120
- Percentage of all workers that are full time: 85.0%
- Percentage of all workers that are part time: 14.9%
- Unemployment rate for all workers: 3.7%

Photo Credit: Sean Pavone / Shutterstock
8. Kentucky
- Share of workforce that are temporary workers: 2.7%
- Total temporary workers: 51,670
- Percentage of all workers that are full time: 83.6%
- Percentage of all workers that are part time: 16.3%
- Unemployment rate for all workers: 3.9%

Photo Credit: Sean Pavone / Shutterstock
7. Alabama
- Share of workforce that are temporary workers: 2.7%
- Total temporary workers: 55,960
- Percentage of all workers that are full time: 86.9%
- Percentage of all workers that are part time: 13.0%
- Unemployment rate for all workers: 2.6%

Photo Credit: Sean Pavone / Shutterstock
6. Indiana
- Share of workforce that are temporary workers: 2.7%
- Total temporary workers: 84,560
- Percentage of all workers that are full time: 83.4%
- Percentage of all workers that are part time: 16.5%
- Unemployment rate for all workers: 3.0%

Photo Credit: Mihai Andritoiu / Shutterstock
5. New Jersey
- Share of workforce that are temporary workers: 2.8%
- Total temporary workers: 115,810
- Percentage of all workers that are full time: 84.0%
- Percentage of all workers that are part time: 15.9%
- Unemployment rate for all workers: 3.7%

Photo Credit: Sean Pavone / Shutterstock
4. Georgia
- Share of workforce that are temporary workers: 2.8%
- Total temporary workers: 131,640
- Percentage of all workers that are full time: 85.7%
- Percentage of all workers that are part time: 14.2%
- Unemployment rate for all workers: 3.0%

Photo Credit: Sean Pavone / Shutterstock
3. Tennessee
- Share of workforce that are temporary workers: 3.1%
- Total temporary workers: 99,720
- Percentage of all workers that are full time: 84.5%
- Percentage of all workers that are part time: 15.4%
- Unemployment rate for all workers: 3.4%

Photo Credit: Rudy Balasko / Shutterstock
2. Illinois
- Share of workforce that are temporary workers: 3.2%
- Total temporary workers: 189,630
- Percentage of all workers that are full time: 82.9%
- Percentage of all workers that are part time: 17.0%
- Unemployment rate for all workers: 4.6%
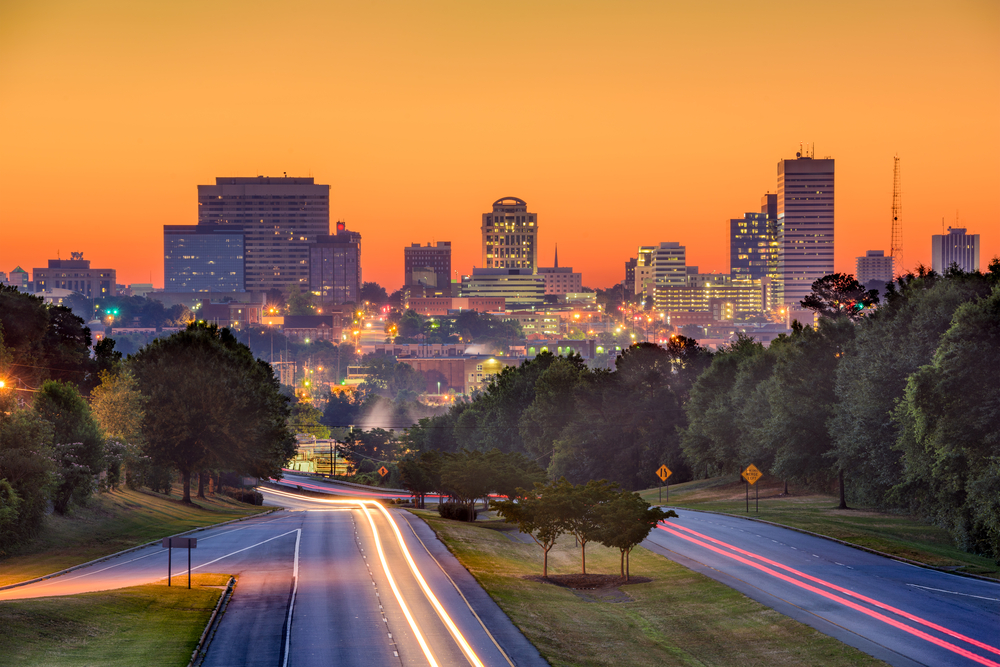
Photo Credit: Sean Pavone / Shutterstock
1. South Carolina
- Share of workforce that are temporary workers: 3.3%
- Total temporary workers: 71,120
- Percentage of all workers that are full time: 85.8%
- Percentage of all workers that are part time: 14.1%
- Unemployment rate for all workers: 3.2%
Detailed Findings & Methodology
To determine the states with the most temp workers, researchers at Smartest Dollar analyzed the latest employment data from the U.S. Bureau of Labor Statistics’s 2022 Occupational Employment and Wage Statistics, 2021 Geographic Profile of Employment and Unemployment, and 2022 Local Area Unemployment Statistics. The researchers ranked states according to the share of the workforce that are temporary workers. In the event of a tie, the state with the larger number of temporary workers was ranked higher. Researchers also calculated the total number of temporary workers, the percentage of all workers that are full time and part time, and the local unemployment rate for all workers. For the purposes of this analysis, only temporary workers from nonfarm establishments were included for relevance.
By clicking the above links, you will go to one of our insurance partners. The specific companies listed above may not be included in our partner's network at this time.