U.S. States With the Most Bankruptcies in 2022
The COVID-19 pandemic provided an unexpected financial boost to many in the U.S., but with the economy potentially facing a recession, households and businesses could have challenging months and years ahead. And after years of encouraging downward trends, this could mean that bankruptcies in the U.S. will once again be in focus.
The pandemic’s impact on consumer debt was one pleasant economic surprise. Amid government stimulus payments and forbearance policies, increased savings during COVID shutdowns, and a tight labor market with opportunities for wage growth, Americans have made strong progress in paying down debt over the last two years. But more recently, with inflation eating into budgets, lenders raising interest rates, and some industries seeing major layoffs, households are starting to feel greater financial pressures that could make it harder to keep up with debt payments.
RELATED TO BANKRUPTCY
Having the right insurance can help businesses avoid bankruptcy in the event of a lawsuit or disaster. Common commercial policies like general liability, BOP insurance, and professional liability insurance provide protection for the most likely events.
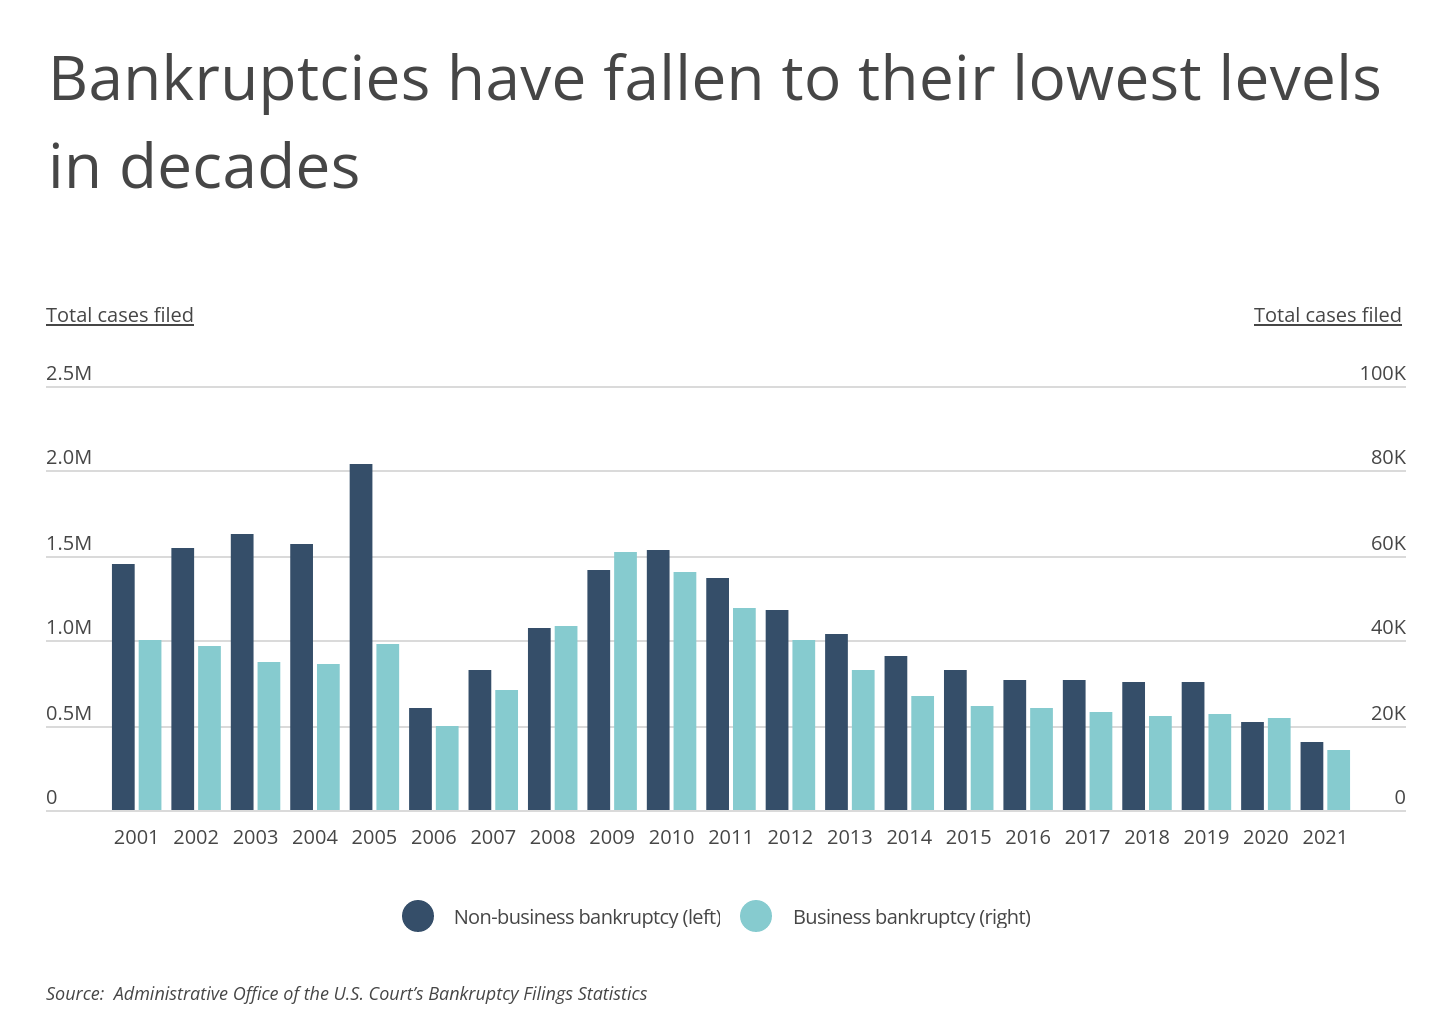
While economic trends during the pandemic unquestionably helped a number of people and businesses with debt, bankruptcies were already declining steadily amid the recovery from the Great Recession. In 2009, business bankruptcy cases hit a peak of more than 60,000, while in 2010, non-business bankruptcies soared to a recession-era peak of 1.5 million. By 2019, business bankruptcies had declined by nearly two-thirds to 22,780, and non-business bankruptcies by around half to 752,160. Both figures fell even further in 2020 and 2021 in the wake of the pandemic.
RELATED
While certain business insurance policies will help avoid bankruptcy altogether, a directors and officers insurance policy will protect the owners’ finances should a bankruptcy occur.
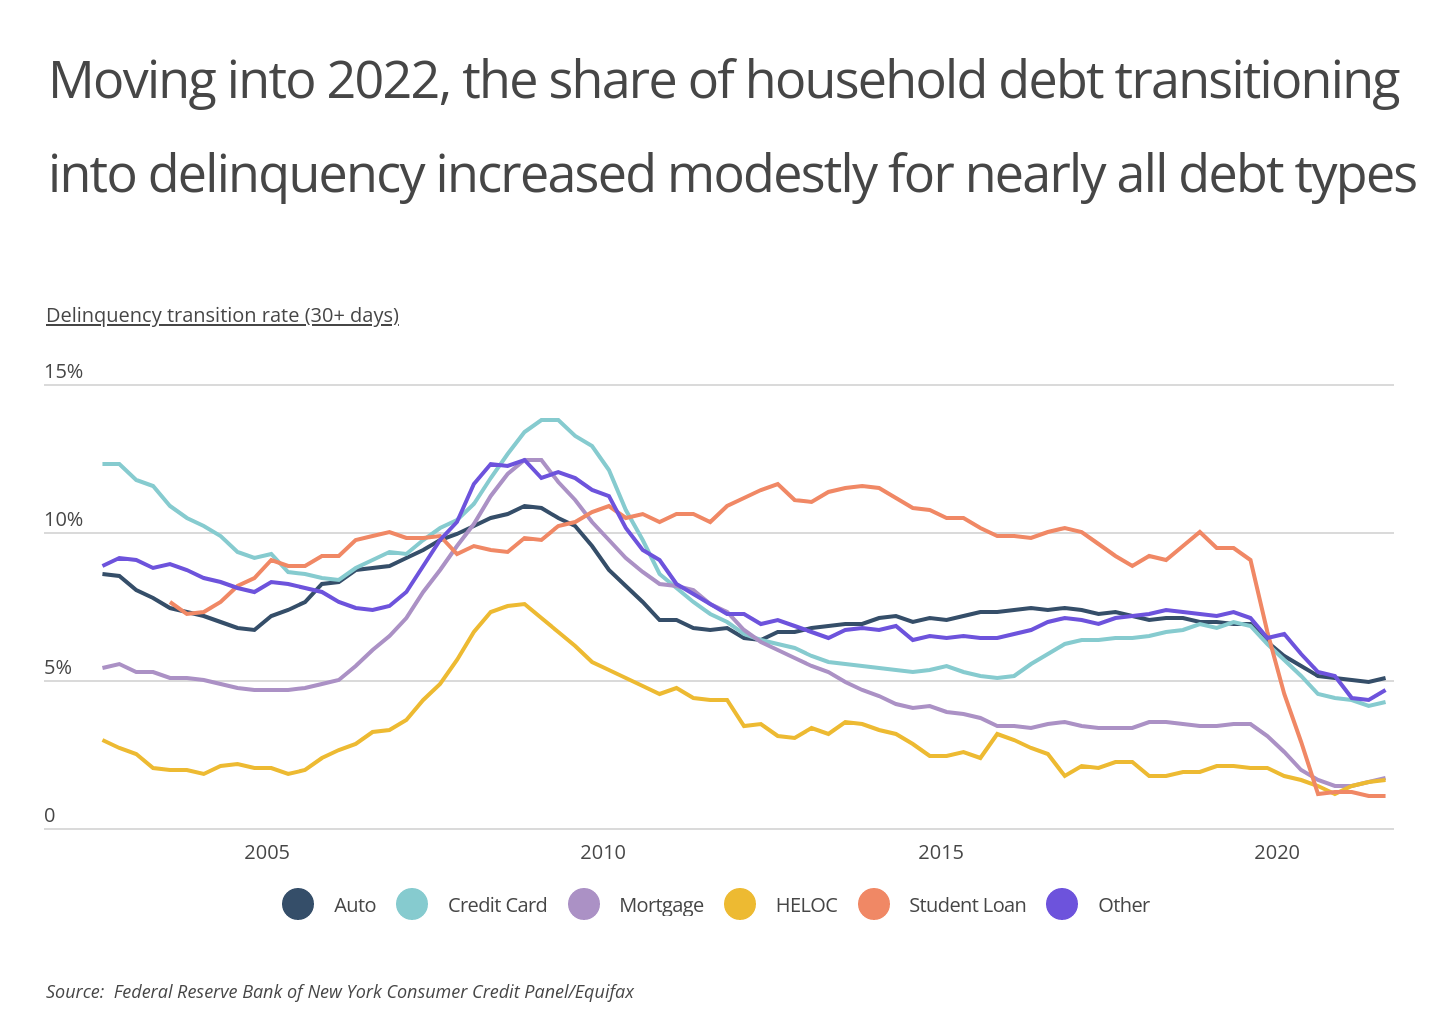
Similar patterns have played out with delinquency in household debt-defined as having payments more than 30 days past due. Almost every major form of household debt spiked during the Great Recession, declined during the recovery, and fell off further beginning in 2020. The exception is student loan debt delinquency, which stayed fairly level following the recession but plummeted due to COVID when the federal government introduced loan forbearance policies that have remained in place for more than two years.
But despite encouraging trends over the last decade, data from early in 2021 suggests that the economy may have reached an inflection point. Delinquency rates remain at historic lows but started moving upward again in the first quarter of 2022 for every form of household debt except student loans. As the impact of inflation and rising interest rates set in further, delinquencies and bankruptcies could grow more common.
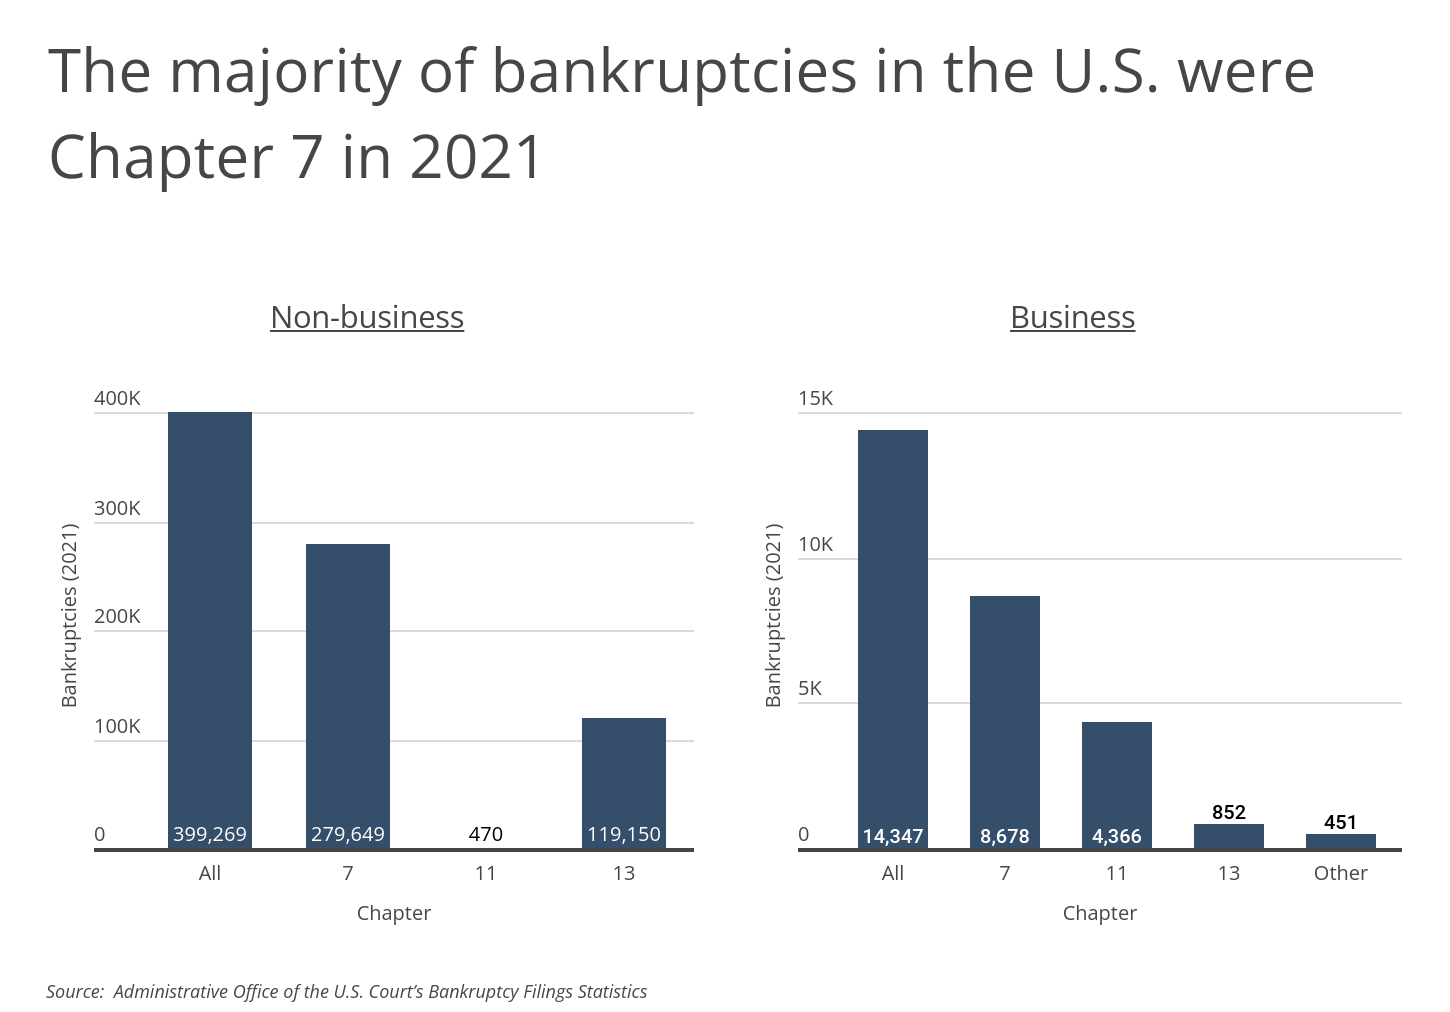
If bankruptcies rise again, the largest share is likely to come from Chapter 7 liquidation, which is the most common form for both business and non-business bankruptcies. Chapter 7 entails selling off certain property or assets to generate cash to pay creditors. Chapter 13 bankruptcy, which involves the creation of debt repayment plans, is the next most common form for non-business debts, while Chapter 11 reorganization is most commonly used by larger businesses.
Bankruptcies in the U.S. are also spread unevenly across geography. Many of the locations that currently struggle most with debt are located in more economically distressed parts of the country. Southern states make up six of the 10 states with the most bankruptcies, and they are joined at the top of the list by a number of Rust Belt locations like Indiana and Ohio.
The data used in this analysis is from the Administrative Office of the U.S. Courts, U.S. Census Bureau, and Experian. To determine the states with the most bankruptcies in 2021, researchers at Smartest Dollar calculated the number of bankruptcies per million residents.
Here are the states with the most bankruptcies per capita.
States With the Most Bankruptcies

Photo Credit: Tupungato / Shutterstock
15. Missouri
- Bankruptcies per million residents (2021): 1,590
- Business bankruptcies per million residents (2021): 24
- Non-business bankruptcies per million residents (2021): 1,566
- Average credit score (2021): 711
- Unemployment rate (2020): 4.5%

Photo Credit: f11photo / Shutterstock
14. Wisconsin
- Bankruptcies per million residents (2021): 1,598
- Business bankruptcies per million residents (2021): 33
- Non-business bankruptcies per million residents (2021): 1,565
- Average credit score (2021): 735
- Unemployment rate (2020): 3.6%

Photo Credit: wonderlustpicstravel / Shutterstock
13. Illinois
- Bankruptcies per million residents (2021): 1,647
- Business bankruptcies per million residents (2021): 43
- Non-business bankruptcies per million residents (2021): 1,604
- Average credit score (2021): 719
- Unemployment rate (2020): 6.0%

Photo Credit: Mrbrown928 / Shutterstock
12. Michigan
- Bankruptcies per million residents (2021): 1,697
- Business bankruptcies per million residents (2021): 25
- Non-business bankruptcies per million residents (2021): 1,671
- Average credit score (2021): 719
- Unemployment rate (2020): 6.0%

Photo Credit: Paul Brady Photography / Shutterstock
11. Delaware
- Bankruptcies per million residents (2021): 1,723
- Business bankruptcies per million residents (2021): 691
- Non-business bankruptcies per million residents (2021): 1,031
- Average credit score (2021): 714
- Unemployment rate (2020): 5.8%

Photo Credit: photo.ua / Shutterstock
10. Utah
- Bankruptcies per million residents (2021): 1,769
- Business bankruptcies per million residents (2021): 25
- Non-business bankruptcies per million residents (2021): 1,745
- Average credit score (2021): 727
- Unemployment rate (2020): 3.6%

Photo Credit: aceshot1 / Shutterstock
9. Ohio
- Bankruptcies per million residents (2021): 1,783
- Business bankruptcies per million residents (2021): 30
- Non-business bankruptcies per million residents (2021): 1,753
- Average credit score (2021): 715
- Unemployment rate (2020): 5.3%

Photo Credit: mnapoli / Shutterstock
8. Arkansas
- Bankruptcies per million residents (2021): 1,824
- Business bankruptcies per million residents (2021): 41
- Non-business bankruptcies per million residents (2021): 1,783
- Average credit score (2021): 694
- Unemployment rate (2020): 5.2%

Photo Credit: Luciano Mortula – LGM / Shutterstock
7. Georgia
- Bankruptcies per million residents (2021): 2,015
- Business bankruptcies per million residents (2021): 45
- Non-business bankruptcies per million residents (2021): 1,970
- Average credit score (2021): 693
- Unemployment rate (2020): 5.6%

Photo Credit: Harold Stiver / Shutterstock
6. Kentucky
- Bankruptcies per million residents (2021): 2,038
- Business bankruptcies per million residents (2021): 24
- Non-business bankruptcies per million residents (2021): 2,014
- Average credit score (2021): 702
- Unemployment rate (2020): 5.4%

Photo Credit: Pete Niesen / Shutterstock
5. Mississippi
- Bankruptcies per million residents (2021): 2,068
- Business bankruptcies per million residents (2021): 50
- Non-business bankruptcies per million residents (2021): 2,018
- Average credit score (2021): 681
- Unemployment rate (2020): 7.1%

Photo Credit: Rudy Balasko / Shutterstock
4. Indiana
- Bankruptcies per million residents (2021): 2,163
- Business bankruptcies per million residents (2021): 29
- Non-business bankruptcies per million residents (2021): 2,134
- Average credit score (2021): 712
- Unemployment rate (2020): 4.7%

Photo Credit: The Speedy Butterfly / Shutterstock
3. Tennessee
- Bankruptcies per million residents (2021): 2,280
- Business bankruptcies per million residents (2021): 33
- Non-business bankruptcies per million residents (2021): 2,247
- Average credit score (2021): 701
- Unemployment rate (2020): 5.3%

Photo Credit: f11photo / Shutterstock
2. Nevada
- Bankruptcies per million residents (2021): 2,308
- Business bankruptcies per million residents (2021): 75
- Non-business bankruptcies per million residents (2021): 2,234
- Average credit score (2021): 701
- Unemployment rate (2020): 6.6%

Photo Credit: Sean Pavone / Shutterstock
1. Alabama
- Bankruptcies per million residents (2021): 3,053
- Business bankruptcies per million residents (2021): 32
- Non-business bankruptcies per million residents (2021): 3,021
- Average credit score (2021): 691
- Unemployment rate (2020): 5.6%
Detailed Findings & Methodology
The data used in this analysis is from the U.S. Census Bureau’s American Community Survey (2020), the Administrative Office of the U.S. Court’s Bankruptcy Filings Statistics, and Experian’s FICO Credit Score by State dataset. To determine the states with the most bankruptcies, researchers at Smartest Dollar calculated the number of bankruptcies per million residents. The number of bankruptcies were for the year 2021, while population data is from 2020, which is the latest data available. Note, the unemployment rate used for the analysis is for ages 16 and older.
By clicking the above links, you will go to one of our insurance partners. The specific companies listed above may not be included in our partner's network at this time.