U.S. States With the Largest Drop in Services Spending During COVID-19
Amid rising inflation, consumers nationwide are now facing increased prices for a wide variety of goods. The COVID-19 pandemic disrupted global supply chains at the same time that many households had more to spend from government stimulus funds, increased savings, and rising incomes. The economy is now seeing the effects, with significantly higher prices for goods like cars and home appliances due to low supply and heightened demand.
One of the factors contributing to inflation in the price of goods is lower spending in services during the pandemic. Service-based industries like transportation, lodging, restaurants, and entertainment venues have seen weakened demand due to consumer concerns about exposure to COVID-19. Dollars that might have gone toward services have increasingly flowed toward durable goods instead. For example, many households sought out substitutes when services were restricted, like home exercise equipment for fitness or consumer electronics for entertainment. Others took rising wages and money saved from forgoing trips, performances, and restaurant meals and used it for big-ticket purchases like cars, furniture, and technology.
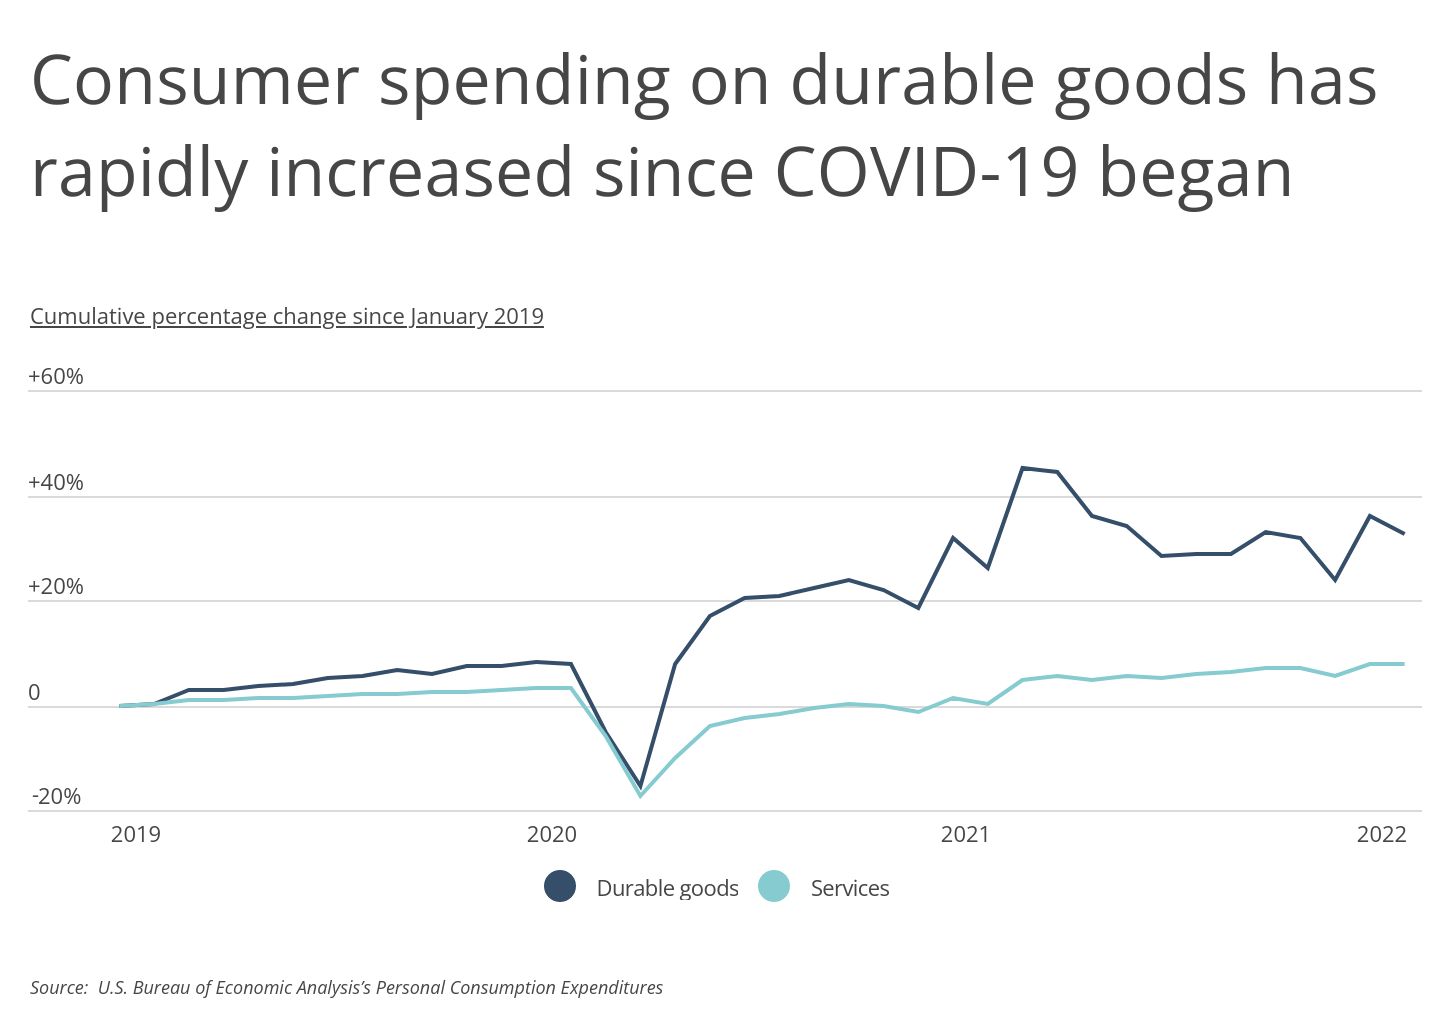
Data from the U.S. Bureau of Economic Analysis shows how spending between goods and services has differed during the pandemic. Both categories saw sharp declines in spending in the wake of COVID-19 shutdowns in March and April 2020. But while both categories have since bounced back over time, the growth in spending on durable goods has increased at a much faster rate. Spending on durable goods is now 32.7% higher than it was at the beginning of 2019, while spending on services is up only 7.7% over the same span.
RELATED
For manufacturers of durable goods, product liability insurance will protect against claims of damages caused by these products. Be sure to read our latest guide on product liability insurance for small business.
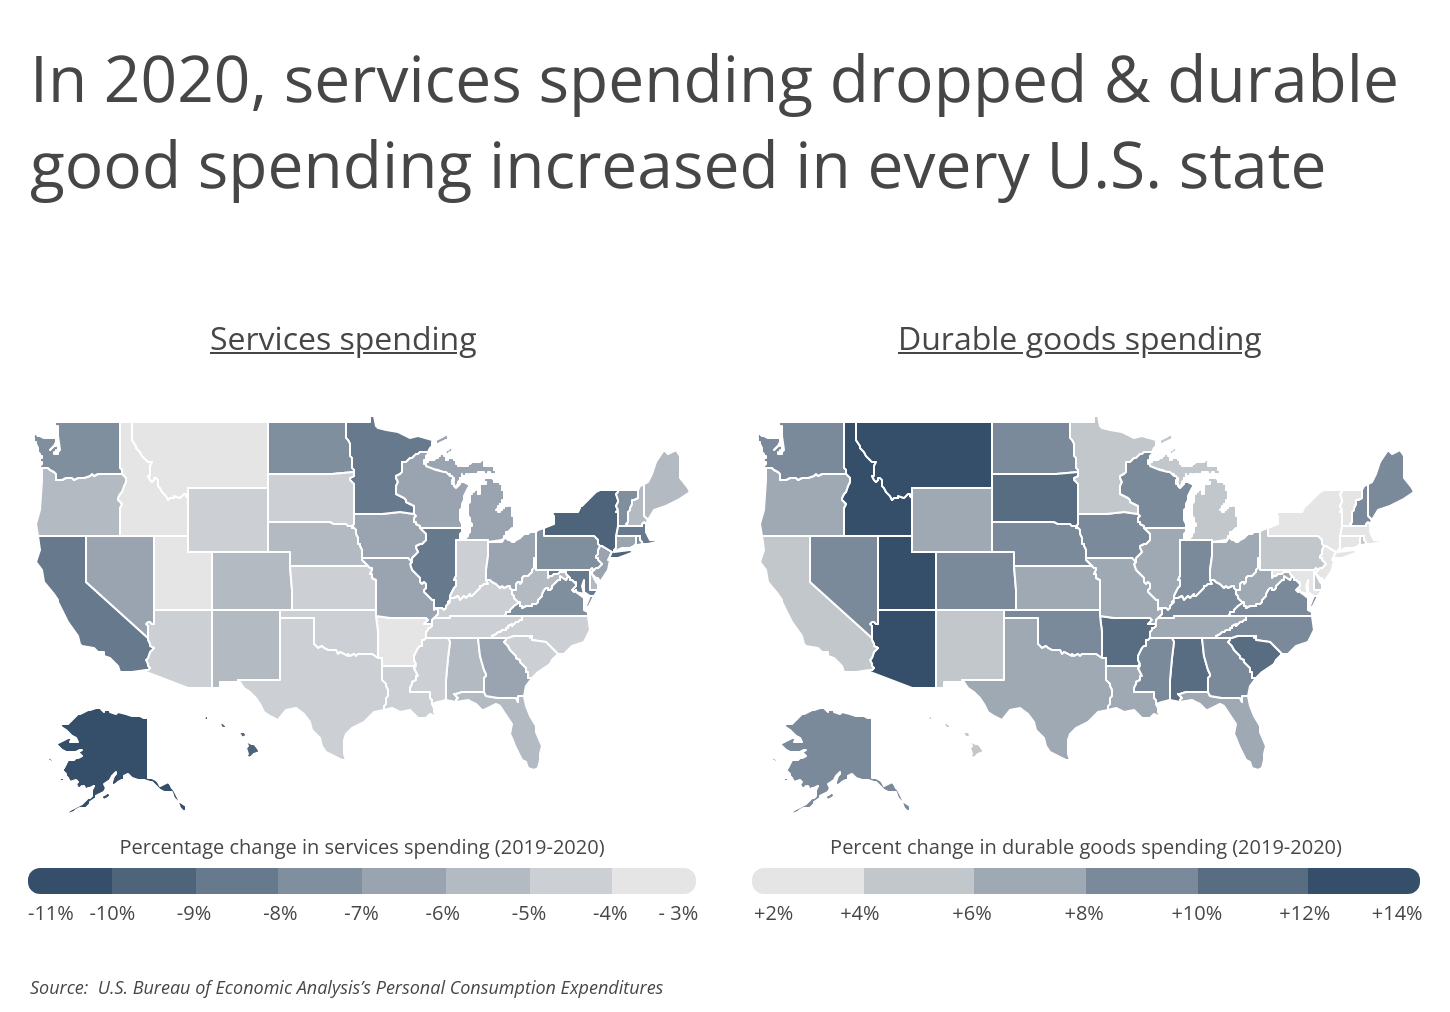
The divergence between increased spending on durable goods and decreased spending on services in 2020 was apparent nationwide, but the magnitude of these trends varied by state. States with lower drops in spending on services included Mountain West locations like Idaho, Montana, and Arizona, where COVID outbreaks did not appear until later than many parts of the country and residents may have been more inclined to spend as usual.
In contrast, states with the biggest drop in services spending included remote states like Alaska and Hawaii, where residents spend large amounts to travel in normal years were unable to during COVID. Other states like New York, Massachusetts, and California also saw large drops due to significant COVID outbreaks and stringent public health restrictions affecting businesses like restaurants and entertainment venues.
RELATED
One of the most important forms of insurance for service companies is professional liability insurance. The best professional liability insurance companies will provide protection for these businesses in the event of a lawsuit related to their work.
The data used in this analysis is from the U.S. Bureau of Economic Analysis. To determine the states with the largest drop in services spending during COVID-19, researchers at Smartest Dollar calculated the percentage change in household consumption expenditures for services from 2019 to 2020. In the event of a tie, the state with the greater total decrease in services spending was ranked higher. Services spending includes health care services, recreation services, food services, accommodations, financial services, and insurance, among others. Durable goods spending includes things like appliances, home furnishings, outdoor equipment, electronics, sporting goods, and vehicles.
Here are the states with the largest drop in services spending during COVID.
States With the Largest Drop in Services Spending During COVID

Photo Credit: Luciano Mortula – LGM / Shutterstock
15. Georgia
- Percentage change in services spending (2019-2020): -6.8%
- Total change in services spending (2019-2020): -$18,509,200,000
- Percent change in durable goods spending (2019-2020): +9.6%
- Total change in durable goods spending (2019-2020): +$4,396,000,000
- Per capita services spending (2020): $23,701
- Per capita durable goods spending (2020): $4,687

Photo Credit: f11photo / Shutterstock
14. Washington
- Percentage change in services spending (2019-2020): -7.1%
- Total change in services spending (2019-2020): -$17,388,600,000
- Percent change in durable goods spending (2019-2020): +8.6%
- Total change in durable goods spending (2019-2020): +$3,358,900,000
- Per capita services spending (2020): $29,678
- Per capita durable goods spending (2020): $5,504

Photo Credit: Richard Cavalleri / Shutterstock
13. Rhode Island
- Percentage change in services spending (2019-2020): -7.5%
- Total change in services spending (2019-2020): -$2,361,000,000
- Percent change in durable goods spending (2019-2020): +4.5%
- Total change in durable goods spending (2019-2020): +$191,200,000
- Per capita services spending (2020): $27,388
- Per capita durable goods spending (2020): $4,240

Photo Credit: Sean Pavone / Shutterstock
12. Virginia
- Percentage change in services spending (2019-2020): -7.6%
- Total change in services spending (2019-2020): -$19,051,300,000
- Percent change in durable goods spending (2019-2020): +8.0%
- Total change in durable goods spending (2019-2020): +$3,233,600,000
- Per capita services spending (2020): $26,939
- Per capita durable goods spending (2020): $5,097
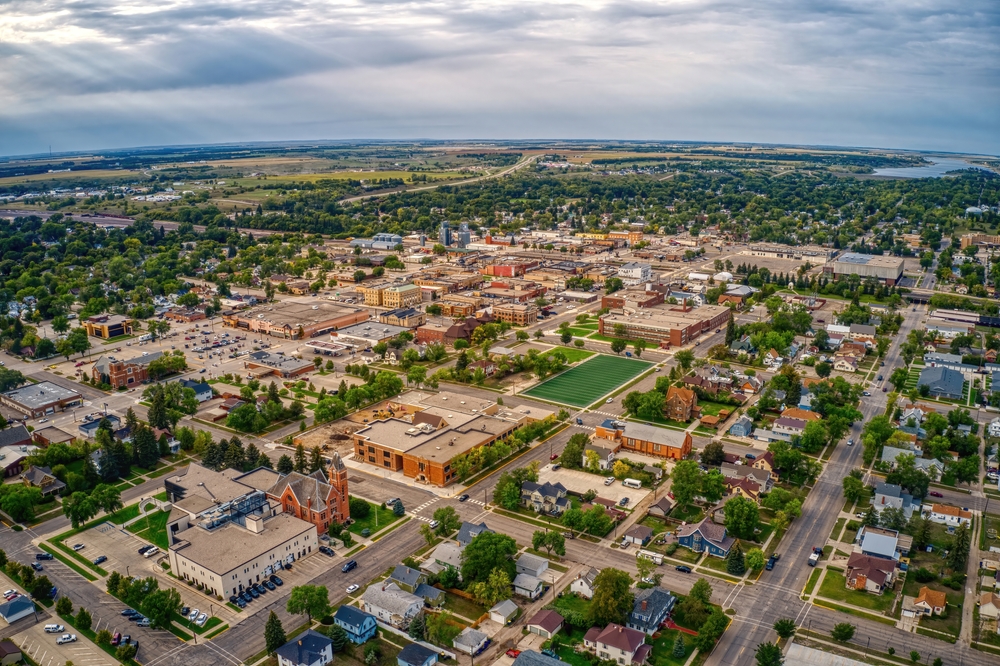
Photo Credit: Jacob Boomsma / Shutterstock
11. North Dakota
- Percentage change in services spending (2019-2020): -7.8%
- Total change in services spending (2019-2020): -$1,774,300,000
- Percent change in durable goods spending (2019-2020): +8.9%
- Total change in durable goods spending (2019-2020): +$359,600,000
- Per capita services spending (2020): $27,278
- Per capita durable goods spending (2020): $5,732

Photo Credit: Gang Liu / Shutterstock
10. Pennsylvania
- Percentage change in services spending (2019-2020): -7.8%
- Total change in services spending (2019-2020): -$30,522,900,000
- Percent change in durable goods spending (2019-2020): +4.7%
- Total change in durable goods spending (2019-2020): +$2,830,800,000
- Per capita services spending (2020): $28,142
- Per capita durable goods spending (2020): $4,887
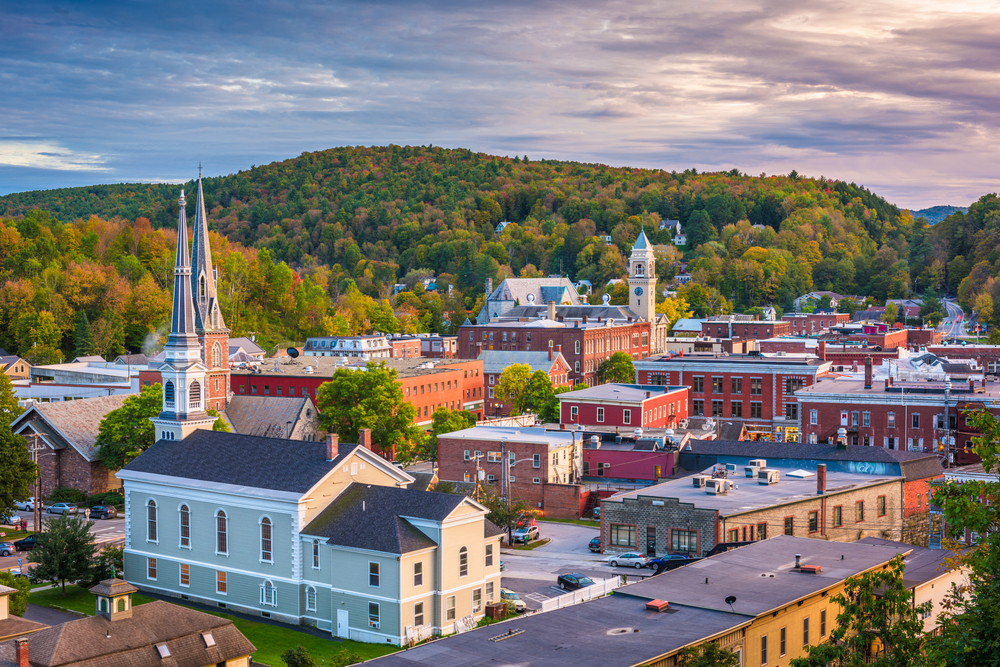
Photo Credit: Sean Pavone / Shutterstock
9. Vermont
- Percentage change in services spending (2019-2020): -8.0%
- Total change in services spending (2019-2020): -$1,565,400,000
- Percent change in durable goods spending (2019-2020): +3.0%
- Total change in durable goods spending (2019-2020): +$90,000,000
- Per capita services spending (2020): $28,897
- Per capita durable goods spending (2020): $4,929

Photo Credit: Checubus / Shutterstock
8. Minnesota
- Percentage change in services spending (2019-2020): -8.3%
- Total change in services spending (2019-2020): -$14,401,900,000
- Percent change in durable goods spending (2019-2020): +5.4%
- Total change in durable goods spending (2019-2020): +$1,669,100,000
- Per capita services spending (2020): $28,245
- Per capita durable goods spending (2020): $5,772

Photo Credit: Eric Urquhart / Shutterstock
7. California
- Percentage change in services spending (2019-2020): -8.3%
- Total change in services spending (2019-2020): -$109,783,100,000
- Percent change in durable goods spending (2019-2020): +4.5%
- Total change in durable goods spending (2019-2020): +$8,007,500,000
- Per capita services spending (2020): $30,960
- Per capita durable goods spending (2020): $4,749

Photo Credit: f11photo / Shutterstock
6. Maryland
- Percentage change in services spending (2019-2020): -8.4%
- Total change in services spending (2019-2020): -$15,999,900,000
- Percent change in durable goods spending (2019-2020): +3.8%
- Total change in durable goods spending (2019-2020): +$1,041,200,000
- Per capita services spending (2020): $28,721
- Per capita durable goods spending (2020): $4,650

Photo Credit: ESB Professional / Shutterstock
5. Massachusetts
- Percentage change in services spending (2019-2020): -8.6%
- Total change in services spending (2019-2020): -$22,081,300,000
- Percent change in durable goods spending (2019-2020): +2.9%
- Total change in durable goods spending (2019-2020): +$1,022,300,000
- Per capita services spending (2020): $34,024
- Per capita durable goods spending (2020): $5,212

Photo Credit: JoelC024 / Shutterstock
4. Illinois
- Percentage change in services spending (2019-2020): -8.6%
- Total change in services spending (2019-2020): -$32,527,800,000
- Percent change in durable goods spending (2019-2020): +6.7%
- Total change in durable goods spending (2019-2020): +$3,870,300,000
- Per capita services spending (2020): $27,316
- Per capita durable goods spending (2020): $4,927

Photo Credit: Lukas Uher / Shutterstock
3. New York
- Percentage change in services spending (2019-2020): -9.3%
- Total change in services spending (2019-2020): -$64,227,600,000
- Percent change in durable goods spending (2019-2020): +1.9%
- Total change in durable goods spending (2019-2020): +$1,561,700,000
- Per capita services spending (2020): $32,338
- Per capita durable goods spending (2020): $4,354

Photo Credit: Izabela23 / Shutterstock
2. Hawaii
- Percentage change in services spending (2019-2020): -9.6%
- Total change in services spending (2019-2020): -$4,294,100,000
- Percent change in durable goods spending (2019-2020): +4.5%
- Total change in durable goods spending (2019-2020): +$238,400,000
- Per capita services spending (2020): $28,612
- Per capita durable goods spending (2020): $3,959
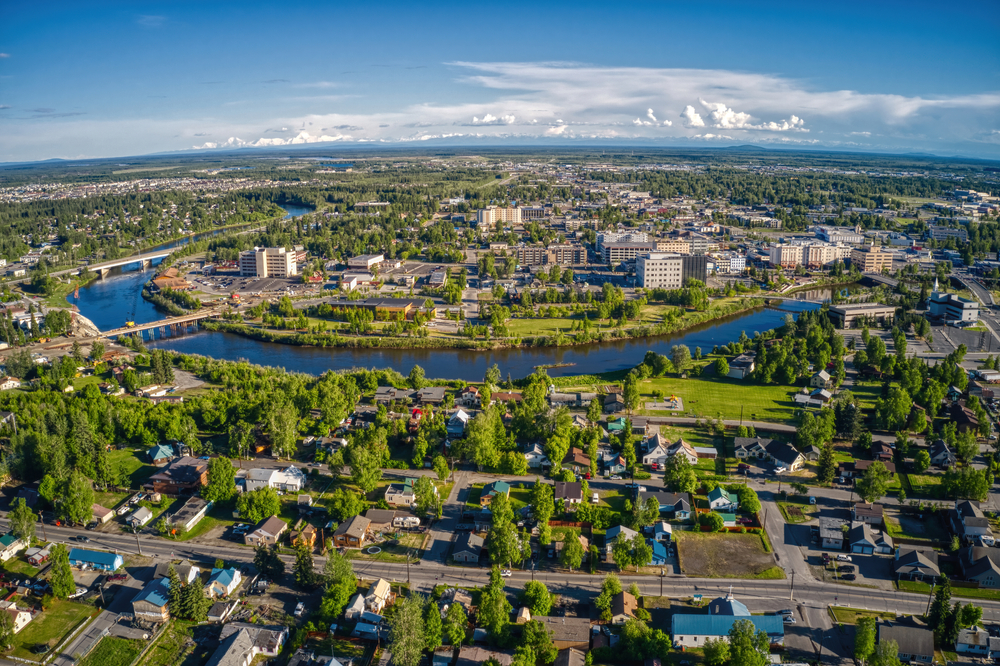
Photo Credit: Jacob Boomsma / Shutterstock
1. Alaska
- Percentage change in services spending (2019-2020): -10.1%
- Total change in services spending (2019-2020): -$2,579,000,000
- Percent change in durable goods spending (2019-2020): +9.1%
- Total change in durable goods spending (2019-2020): +$357,700,000
- Per capita services spending (2020): $31,450
- Per capita durable goods spending (2020): $5,879
Detailed Findings & Methodology
The data used in this analysis is from the U.S. Bureau of Economic Analysis’s Personal Consumption Expenditures. To determine the states with the largest drop in services spending during COVID-19, researchers calculated the percentage change in household consumption expenditures for services from 2019 to 2020. In the event of a tie, the state with the greater total decrease in services spending was ranked higher. Durable goods are defined by the BEA as “tangible products that can be stored or inventoried and that have an average life of at least three years.” Durable goods spending includes things like appliances, home furnishings, outdoor equipment, electronics, sporting goods, and vehicles. Services are defined as “products that cannot be stored and are consumed at the place and time of their purchase.” Services spending includes health care services, recreation services, food services, accommodations, financial services, and insurance, among others.
By clicking the above links, you will go to one of our insurance partners. The specific companies listed above may not be included in our partner's network at this time.