Products & Services Most Impacted by Inflation
Following months of rapid inflation, the U.S. Federal Reserve recently announced its first federal funds rate increases in more than three years. Federal Reserve Chair Jerome Powell followed this action with remarks several days later signaling that more rate increases are in store for 2022.
The Federal Reserve’s recent moves were noteworthy because the U.S. central bank has kept rates near zero for most of the last decade in efforts to boost economic growth following the Great Recession. But the recent spike in inflation prompted new thinking from the Fed. Some economic observers-including Powell-predicted last year that rising inflation would be transitory, leveling out as the COVID-19 pandemic abated and global supply chains recovered. But it now appears that inflation is here for the foreseeable future, and the Federal Reserve hopes to rein it in.
The Federal Reserve typically aims for a target annual inflation rate of 2%, believing that this figure best supports the goal of maximizing employment while also keeping prices stable. Generally, when the Federal Reserve wants to stimulate economic growth, it lowers interest rates, which reduces people and businesses’ costs to borrow money to spend or invest. But when the rate of inflation is too high, the Federal Reserve may raise interest rates to keep price increases under control.
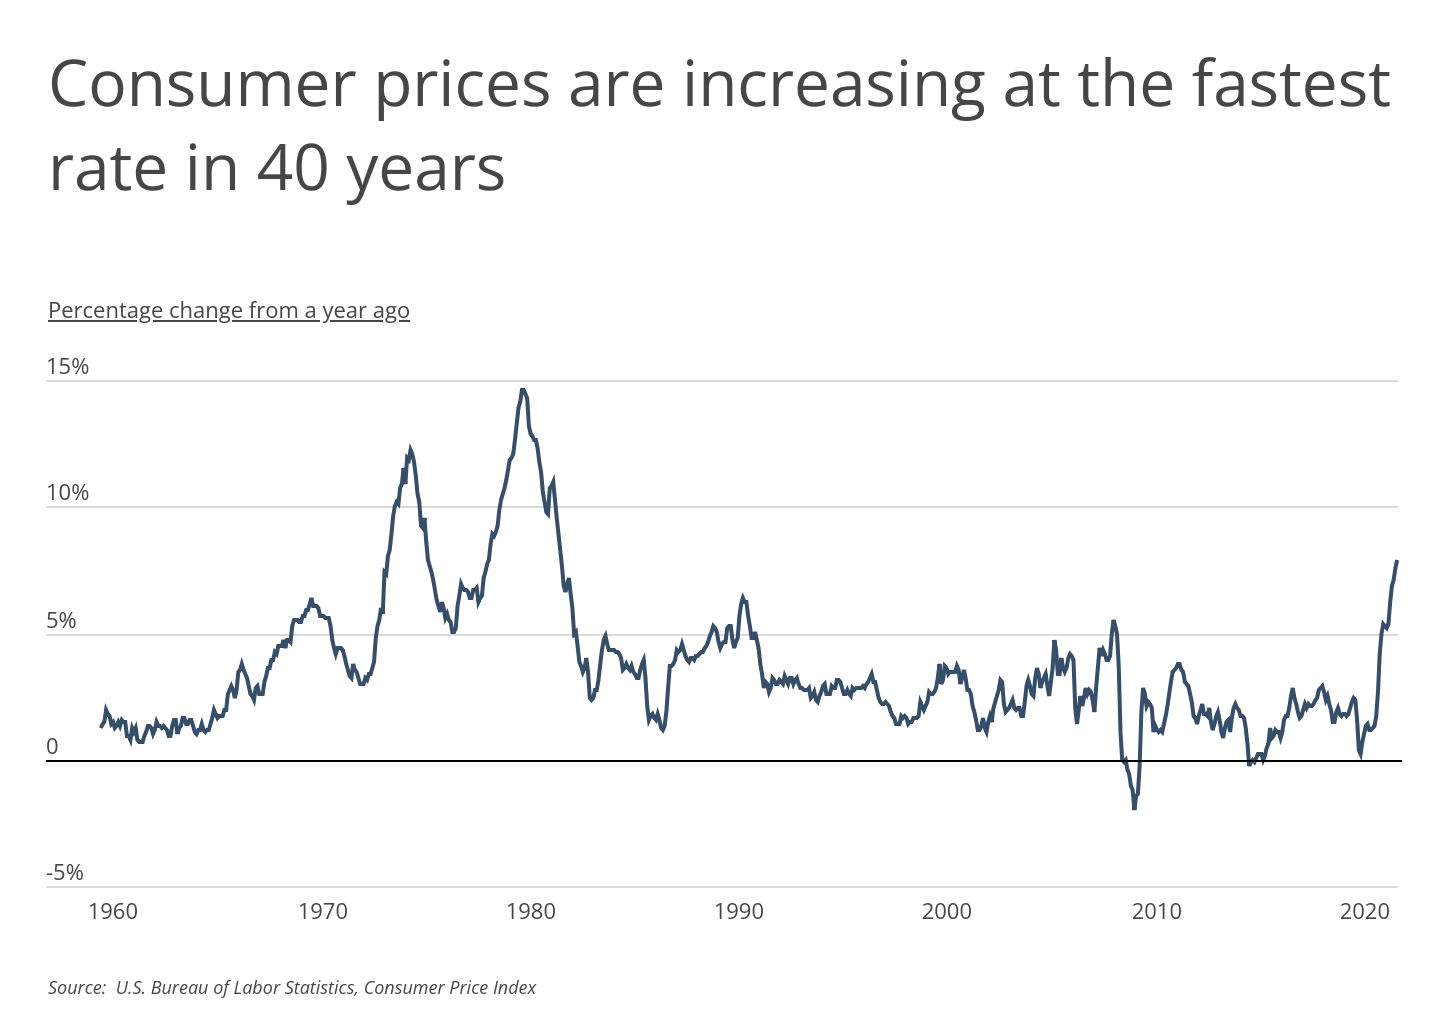
This is the situation the U.S. economy now faces. After inflation in line with or under the 2% target for most of the decade or so after the Great Recession, the last year has brought much faster price increases. According to the Consumer Price Index, year-over-year inflation has topped 5% every month dating back to June 2021 and hit another recent high of 7.91% in February 2022. The recent period of inflation has seen the fastest price increases since the recession of the early 1980s, when year-over-year inflation reached a peak of 14.59% in the spring of 1980.
FOR BUSINESS OWNERS
Even as the costs of operating your business rise, it’s important not forgo adequate insurance. The best small business insurance companies will protect you from the legal risks of running your business and will ultimately save you money should something go wrong. Two of the most popular policies are professional liability insurance and product liability insurance.
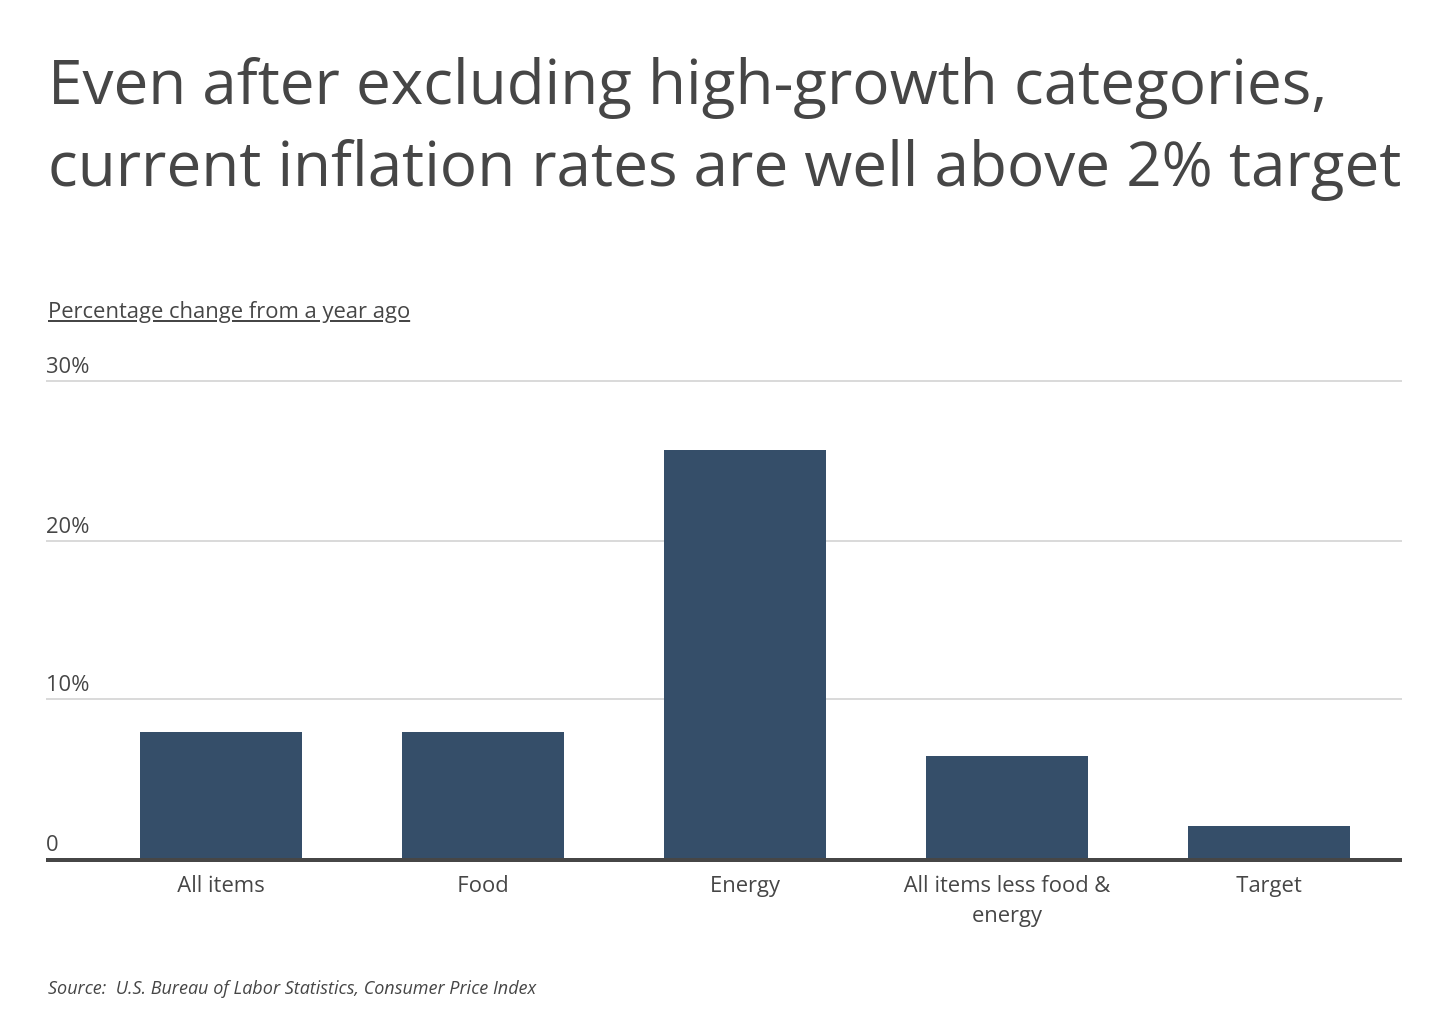
Every major category in the Consumer Price Index has topped the Fed’s 2% inflation target over the last year, but consumers have faced a harder time with some expenses than others. Energy has been one of the single fastest-growing expenses, with a 25.6% overall increase in costs from February 2021 to February 2022. Food-the third-greatest expense for most households after shelter and transportation-has seen a 7.9% overall increase, but many individual food products-especially meats-have seen prices increase much faster. And even after accounting for these high-growth categories, year-over-year inflation still comes out to 6.4%, driven by other major increases in categories from lodging to car parts to new and used vehicles.
The data used in this analysis is from the March 2022 release of the U.S. Bureau of Labor Statistics Consumer Price Index (CPI). To determine the consumer products and services most impacted by inflation, researchers at Smartest Dollar calculated the year-over-year percentage change in the CPI for select items. In the event of a tie, the product or service with the greater seasonally-adjusted percentage change in CPI from January to February of 2022 was ranked higher.
Here are the products and services most impacted by inflation.
Products & Services With the Largest Price Increases

Photo Credit: stockcreations / Shutterstock
15. Fish and seafood
- Year-over-year change in price: +10.4%
- Month-over-month change in price (seasonally adjusted): +1.1%
- Month-over-month change in price (unadjusted): +0.2%
- Relative importance to CPI (0-100): 0.29

Photo Credit: mavo / Shutterstock
14. Coffee
- Year-over-year change in price: +10.5%
- Month-over-month change in price (seasonally adjusted): +1.5%
- Month-over-month change in price (unadjusted): +1.6%
- Relative importance to CPI (0-100): 0.18

Photo Credit: gabriel12 / Shutterstock
13. Fresh fruits
- Year-over-year change in price: +10.6%
- Month-over-month change in price (seasonally adjusted): +3.7%
- Month-over-month change in price (unadjusted): +3.5%
- Relative importance to CPI (0-100): 0.59

Photo Credit: Renamarie / Shutterstock
12. Eggs
- Year-over-year change in price: +11.4%
- Month-over-month change in price (seasonally adjusted): +2.2%
- Month-over-month change in price (unadjusted): +2.2%
- Relative importance to CPI (0-100): 0.11

Photo Credit: Virrage Images / Shutterstock
11. New vehicles
- Year-over-year change in price: +12.4%
- Month-over-month change in price (seasonally adjusted): +0.3%
- Month-over-month change in price (unadjusted): +0.3%
- Relative importance to CPI (0-100): 4.09

Photo Credit: The Toidi / Shutterstock
10. Poultry
- Year-over-year change in price: +12.5%
- Month-over-month change in price (seasonally adjusted): +1.7%
- Month-over-month change in price (unadjusted): +1.7%
- Relative importance to CPI (0-100): 0.34

Photo Credit: New Africa / Shutterstock
9. Pork
- Year-over-year change in price: +14.0%
- Month-over-month change in price (seasonally adjusted): +1.0%
- Month-over-month change in price (unadjusted): +0.7%
- Relative importance to CPI (0-100): 0.36

Photo Credit: Dmitry-Arhangel 29 / Shutterstock
8. Motor vehicle parts and equipment
- Year-over-year change in price: +14.3%
- Month-over-month change in price (seasonally adjusted): +1.6%
- Month-over-month change in price (unadjusted): +1.6%
- Relative importance to CPI (0-100): 0.43
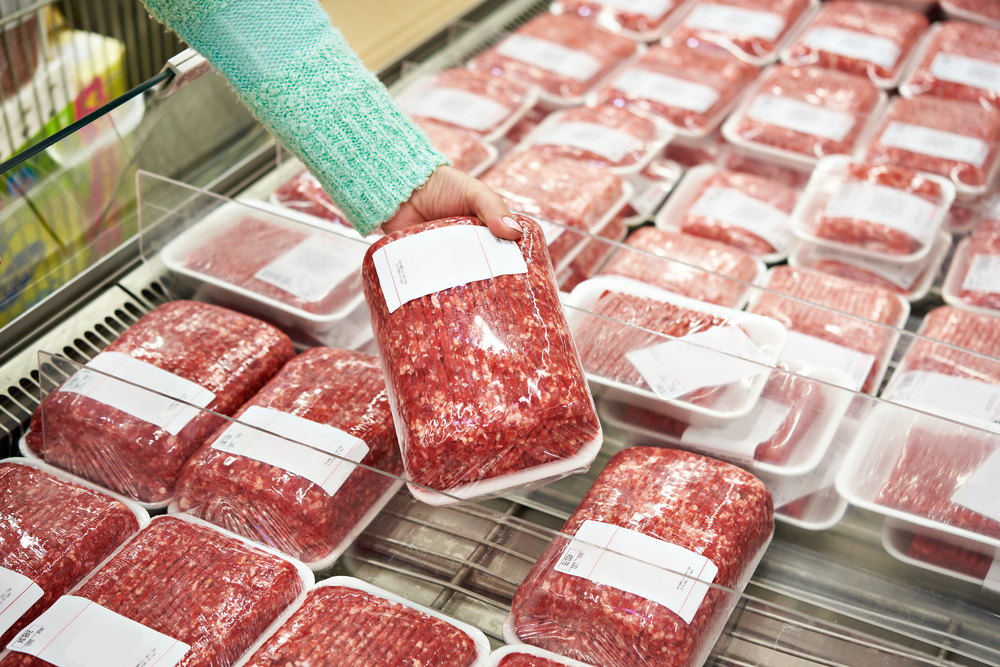
Photo Credit: Sergey Ryzhov / Shutterstock
7. Beef and veal
- Year-over-year change in price: +16.2%
- Month-over-month change in price (seasonally adjusted): +0.8%
- Month-over-month change in price (unadjusted): +0.5%
- Relative importance to CPI (0-100): 0.54
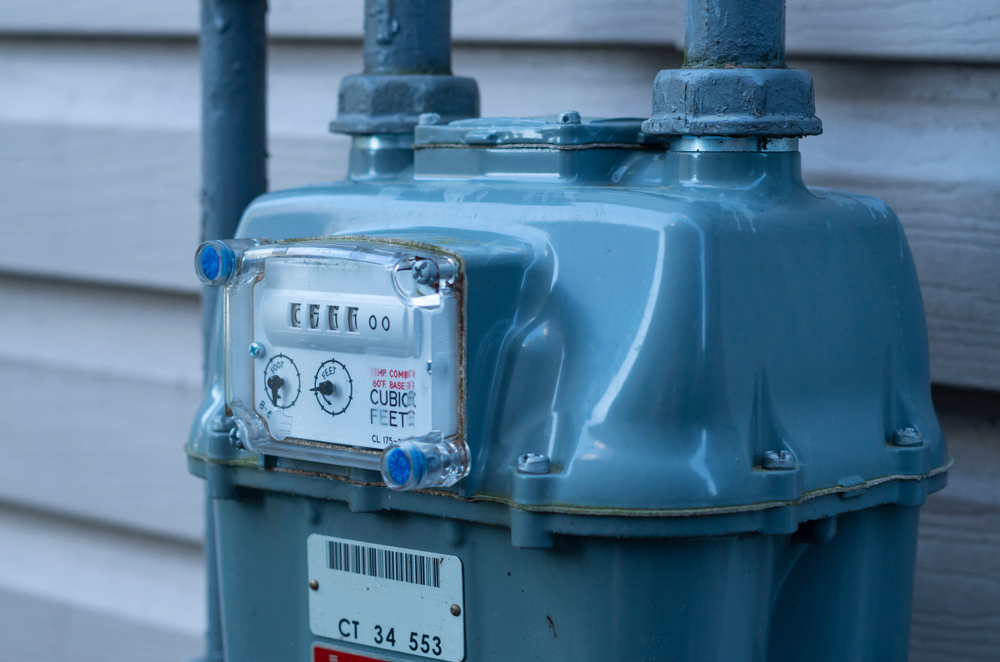
Photo Credit: JWPhotoworks / Shutterstock
6. Utility (piped) gas service
- Year-over-year change in price: +23.8%
- Month-over-month change in price (seasonally adjusted): +1.5%
- Month-over-month change in price (unadjusted): +0.6%
- Relative importance to CPI (0-100): 0.88

Photo Credit: Matushchak Anton / Shutterstock
5. Car and truck rental
- Year-over-year change in price: +24.3%
- Month-over-month change in price (seasonally adjusted): +3.5%
- Month-over-month change in price (unadjusted): +1.4%
- Relative importance to CPI (0-100): 0.14

Photo Credit: Tero Vesalainen / Shutterstock
4. Lodging away from home
- Year-over-year change in price: +25.1%
- Month-over-month change in price (seasonally adjusted): +2.2%
- Month-over-month change in price (unadjusted): +5.5%
- Relative importance to CPI (0-100): 0.90

Photo Credit: Kodda / Shutterstock
3. Fuel oil and other fuels
- Year-over-year change in price: +33.4%
- Month-over-month change in price (seasonally adjusted): +6.5%
- Month-over-month change in price (unadjusted): +6.1%
- Relative importance to CPI (0-100): 0.20
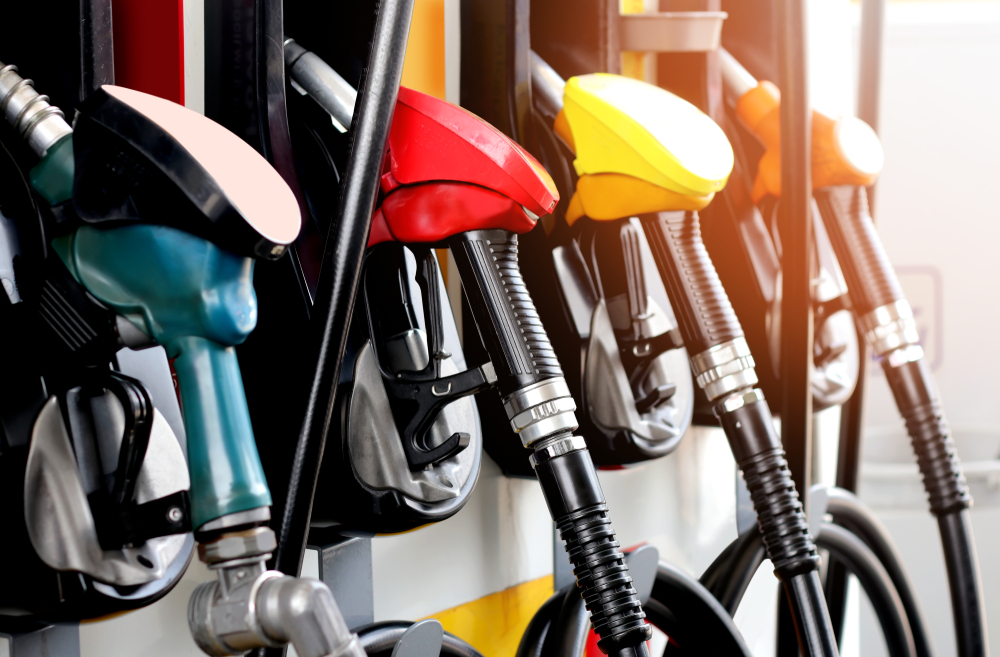
Photo Credit: ThePowerPlant / Shutterstock
2. Motor fuel
- Year-over-year change in price: +38.1%
- Month-over-month change in price (seasonally adjusted): +6.7%
- Month-over-month change in price (unadjusted): +5.4%
- Relative importance to CPI (0-100): 3.79

Photo Credit: Africa Studio / Shutterstock
1. Used cars and trucks
- Year-over-year change in price: +41.2%
- Month-over-month change in price (seasonally adjusted): -0.2%
- Month-over-month change in price (unadjusted): +0.8%
- Relative importance to CPI (0-100): 4.17
Methodology & Detailed Findings
The data used in this analysis is from the March 2022 release of the U.S. Bureau of Labor Statistics Consumer Price Index (CPI), covering data up to February of 2022. To determine the consumer products and services most impacted by inflation, researchers calculated the year-over-year percentage change in the CPI comparing February of 2022 to February of 2021. In the event of a tie, the product or service with the greater seasonally-adjusted percentage change in CPI from January to February of 2022 was ranked higher. To improve relevance, only select CPI categories were included in the analysis.
By clicking the above links, you will go to one of our insurance partners. The specific companies listed above may not be included in our partner's network at this time.