U.S. Cities With the Highest Cost-of-Living Adjusted Salaries
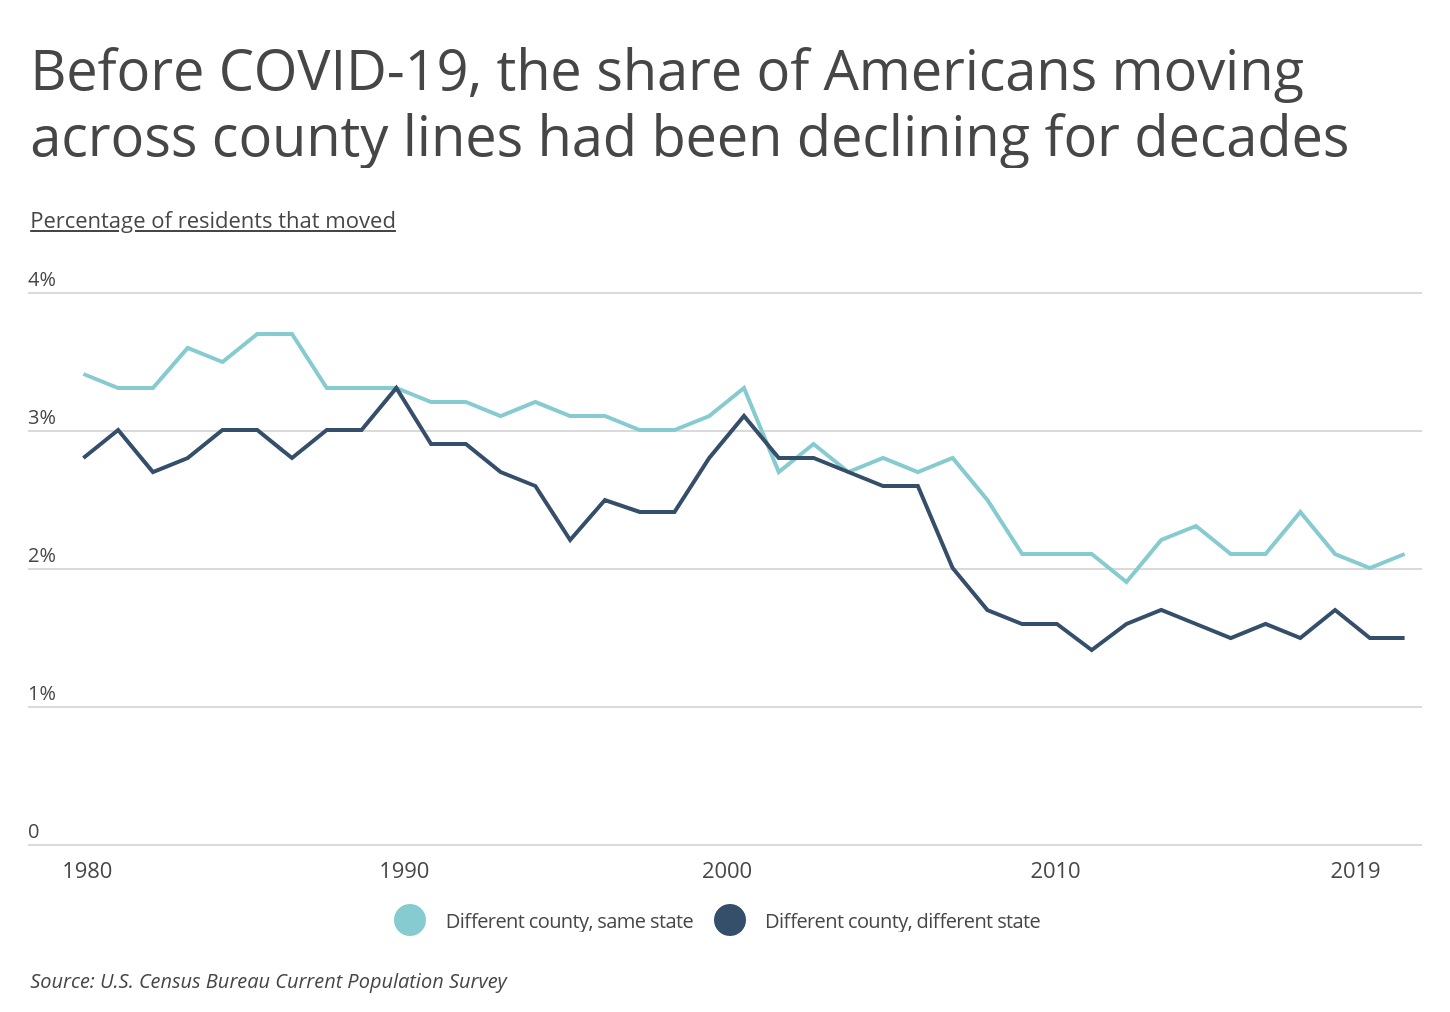
The COVID-19 pandemic has sparked a surge in geographic mobility. According to Pew Research Center, 22 percent of adults in the U.S. have relocated during the pandemic or know someone who did. Interestingly, this reverses a longstanding trend in which Americans were staying put.
Data from the U.S. Census Bureau shows that prior to COVID-19, Americans were moving a lot less. In 1981, 3.4 percent of Americans moved to a different county within the same state while only 2.8 percent moved to a different state entirely. By 2019, those percentages dropped to 2.1 percent and 1.5 percent, respectively. The share of Americans moving across county lines has remained at a relatively flat, low level since 2010.
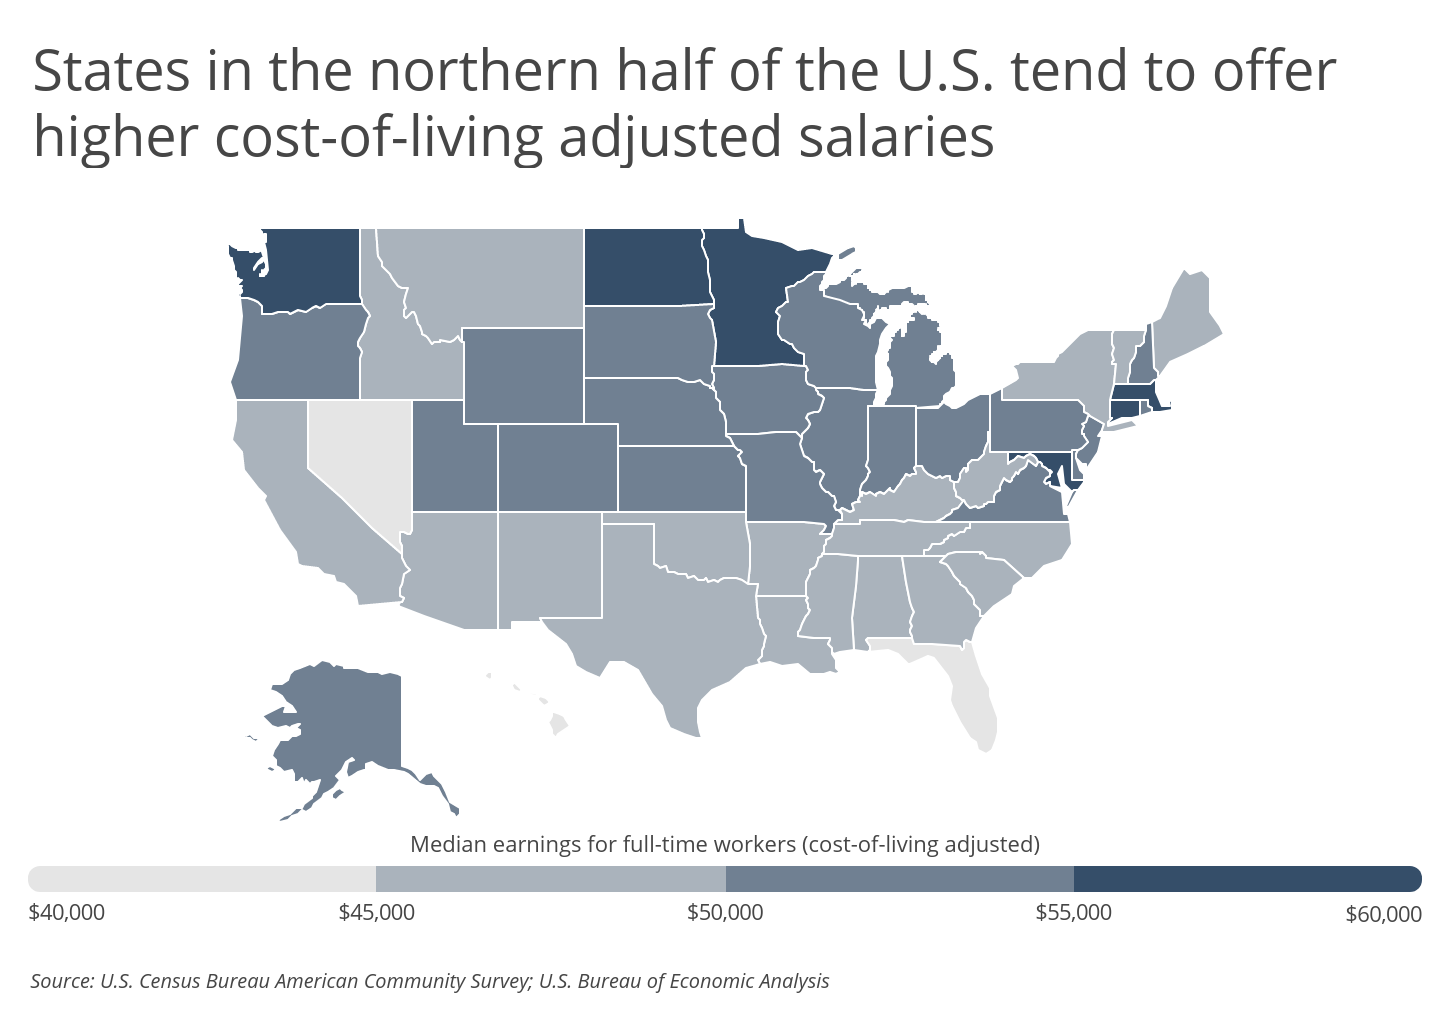
As people think about where to move during COVID-19 and beyond, job prospects and earning potential will be top of mind. Median earnings for full-time workers in the U.S. was $50,078 in 2019, a 20.6 percent increase since 2010 in nominal dollars. However, the relative cost of living in a given area impacts purchasing power and should be an important factor when weighing employment opportunities. There is significant regional variation in cost-of-living adjusted earnings across the U.S., with residents in the Northeast and Midwest generally faring better than those in the South or West. For example, median adjusted earnings range from a low of $41,063 in Florida to a high of $58,029 in Massachusetts.
RELATED
Being self-employed has its advantages and disadvantages. One major advantage is having more control over when you work, where you work, and how much you earn. A major disadvantage is assuming the liabilities associated with owning your own businesses. To help, we’ve created a list of the best small business insurance companies who can help you identify potential risks and provide financial protection should things go wrong.
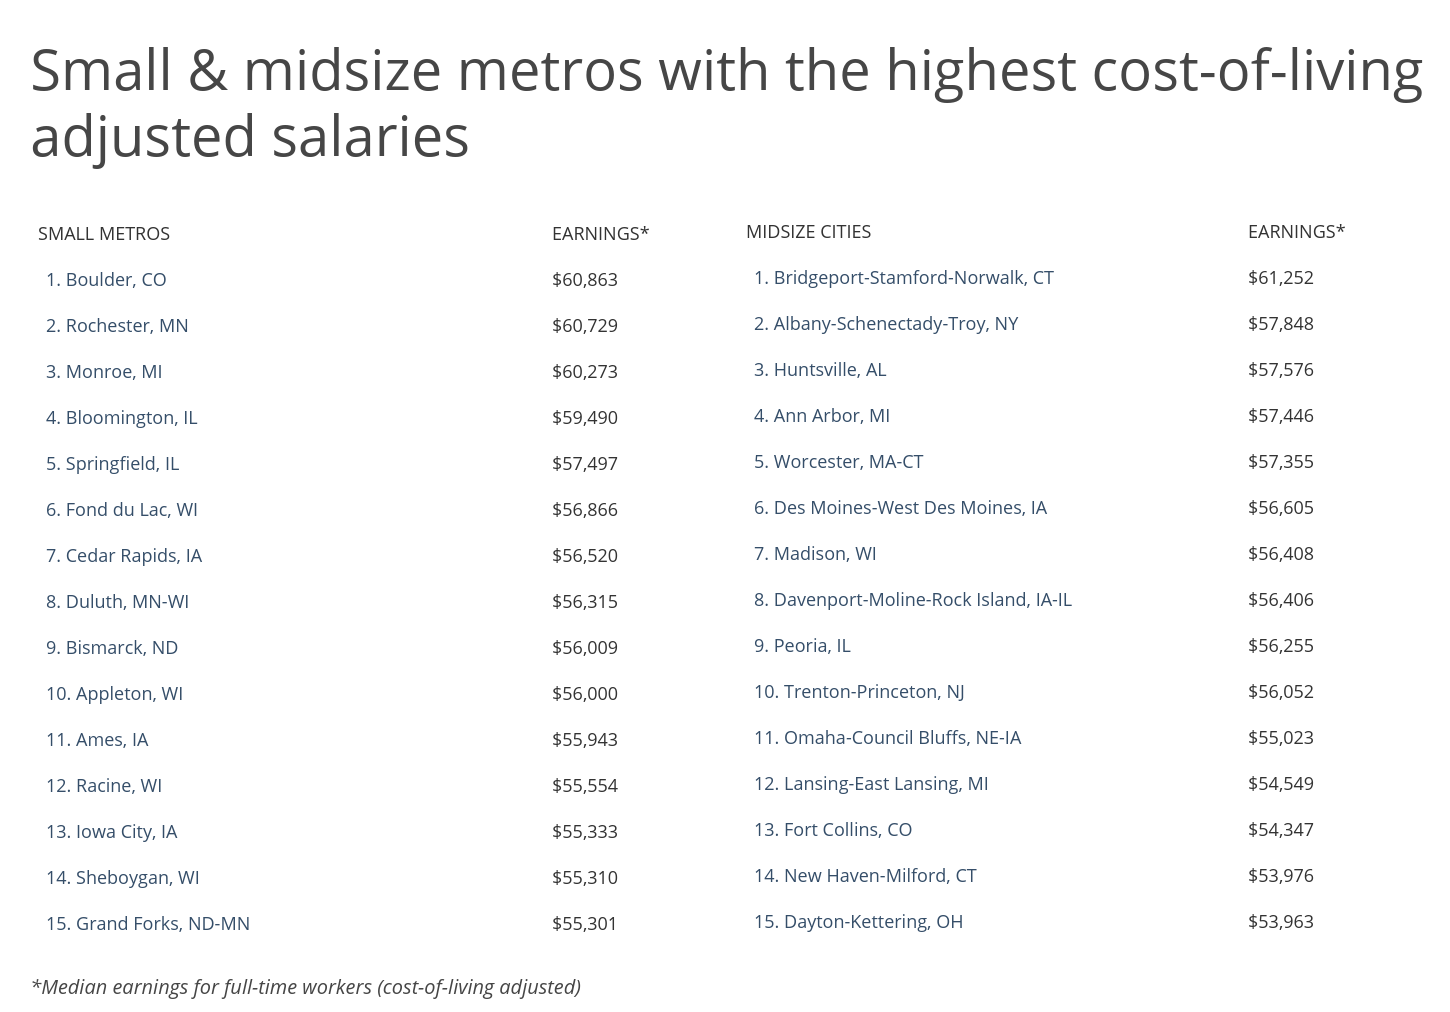
To find which metropolitan areas offer the greatest purchasing power, researchers at Smartest Dollar calculated cost-of-living adjusted earnings using data for full-time workers from the U.S. Census Bureau and U.S. Bureau of Economic Analysis. To improve relevance, metros were grouped into the following categories based on population: small (100,000–349,999), midsize (350,000–999,999), and large (1,000,000 or more).
Similar to the statewide trends, the small and midsize metros offering the highest adjusted earnings are concentrated in the Midwest and Northeast. Unlike the state-level trends, the large metros with the best pay are scattered throughout the country, with similar levels of representation in the Northeast, West, and Midwest. Here are the metropolitan areas with the highest cost-of-living adjusted earnings.
Large Metros With the Highest Adjusted Salaries

Photo Credit: Alamy Stock Photo
15. Columbus, OH
- Median earnings for full-time workers (adjusted): $55,530
- Median earnings for full-time workers (unadjusted): $51,032
- Percentage change since 2010 (unadjusted): 19.2%
- Cost of living (compared to national average): -8.1%

Photo Credit: Alamy Stock Photo
14. Pittsburgh, PA
- Median earnings for full-time workers (adjusted): $55,798
- Median earnings for full-time workers (unadjusted): $51,948
- Percentage change since 2010 (unadjusted): 24.5%
- Cost of living (compared to national average): -6.9%

Photo Credit: Alamy Stock Photo
13. Cleveland-Elyria, OH
- Median earnings for full-time workers (adjusted): $55,892
- Median earnings for full-time workers (unadjusted): $50,359
- Percentage change since 2010 (unadjusted): 18.8%
- Cost of living (compared to national average): -9.9%

Photo Credit: Alamy Stock Photo
12. Denver-Aurora-Lakewood, CO
- Median earnings for full-time workers (adjusted): $55,894
- Median earnings for full-time workers (unadjusted): $58,633
- Percentage change since 2010 (unadjusted): 23.6%
- Cost of living (compared to national average): +4.9%

Photo Credit: Alamy Stock Photo
11. St. Louis, MO-IL
- Median earnings for full-time workers (adjusted): $56,624
- Median earnings for full-time workers (unadjusted): $51,528
- Percentage change since 2010 (unadjusted): 21.8%
- Cost of living (compared to national average): -9.0%

Photo Credit: Alamy Stock Photo
10. Raleigh-Cary, NC
- Median earnings for full-time workers (adjusted): $56,934
- Median earnings for full-time workers (unadjusted): $54,998
- Percentage change since 2010 (unadjusted): 19.7%
- Cost of living (compared to national average): -3.4%

Photo Credit: Alamy Stock Photo
9. Cincinnati, OH-KY-IN
- Median earnings for full-time workers (adjusted): $57,222
- Median earnings for full-time workers (unadjusted): $51,500
- Percentage change since 2010 (unadjusted): 19.8%
- Cost of living (compared to national average): -10.0%

Photo Credit: Alamy Stock Photo
8. Baltimore-Columbia-Towson, MD
- Median earnings for full-time workers (adjusted): $57,575
- Median earnings for full-time workers (unadjusted): $61,432
- Percentage change since 2010 (unadjusted): 20.5%
- Cost of living (compared to national average): +6.7%

Photo Credit: Alamy Stock Photo
7. San Francisco-Oakland-Berkeley, CA
- Median earnings for full-time workers (adjusted): $58,331
- Median earnings for full-time workers (unadjusted): $76,764
- Percentage change since 2010 (unadjusted): 31.5%
- Cost of living (compared to national average): +31.6%

Photo Credit: Alamy Stock Photo
6. Minneapolis-St. Paul-Bloomington, MN-WI
- Median earnings for full-time workers (adjusted): $58,512
- Median earnings for full-time workers (unadjusted): $60,033
- Percentage change since 2010 (unadjusted): 21.3%
- Cost of living (compared to national average): +2.6%

Photo Credit: Alamy Stock Photo
5. Seattle-Tacoma-Bellevue, WA
- Median earnings for full-time workers (adjusted): $58,573
- Median earnings for full-time workers (unadjusted): $66,129
- Percentage change since 2010 (unadjusted): 28.2%
- Cost of living (compared to national average): +12.9%

Photo Credit: Alamy Stock Photo
4. Boston-Cambridge-Newton, MA-NH
- Median earnings for full-time workers (adjusted): $59,046
- Median earnings for full-time workers (unadjusted): $67,430
- Percentage change since 2010 (unadjusted): 24.3%
- Cost of living (compared to national average): +14.2%

Photo Credit: Alamy Stock Photo
3. Washington-Arlington-Alexandria, DC-VA-MD-WV
- Median earnings for full-time workers (adjusted): $59,993
- Median earnings for full-time workers (unadjusted): $70,672
- Percentage change since 2010 (unadjusted): 17.0%
- Cost of living (compared to national average): +17.8%

Photo Credit: Alamy Stock Photo
2. Hartford-East Hartford-Middletown, CT
- Median earnings for full-time workers (adjusted): $60,357
- Median earnings for full-time workers (unadjusted): $61,625
- Percentage change since 2010 (unadjusted): 18.1%
- Cost of living (compared to national average): +2.1%

Photo Credit: Alamy Stock Photo
1. San Jose-Sunnyvale-Santa Clara, CA
- Median earnings for full-time workers (adjusted): $63,727
- Median earnings for full-time workers (unadjusted): $82,463
- Percentage change since 2010 (unadjusted): 30.7%
- Cost of living (compared to national average): +29.4%
Methodology & Detailed Findings
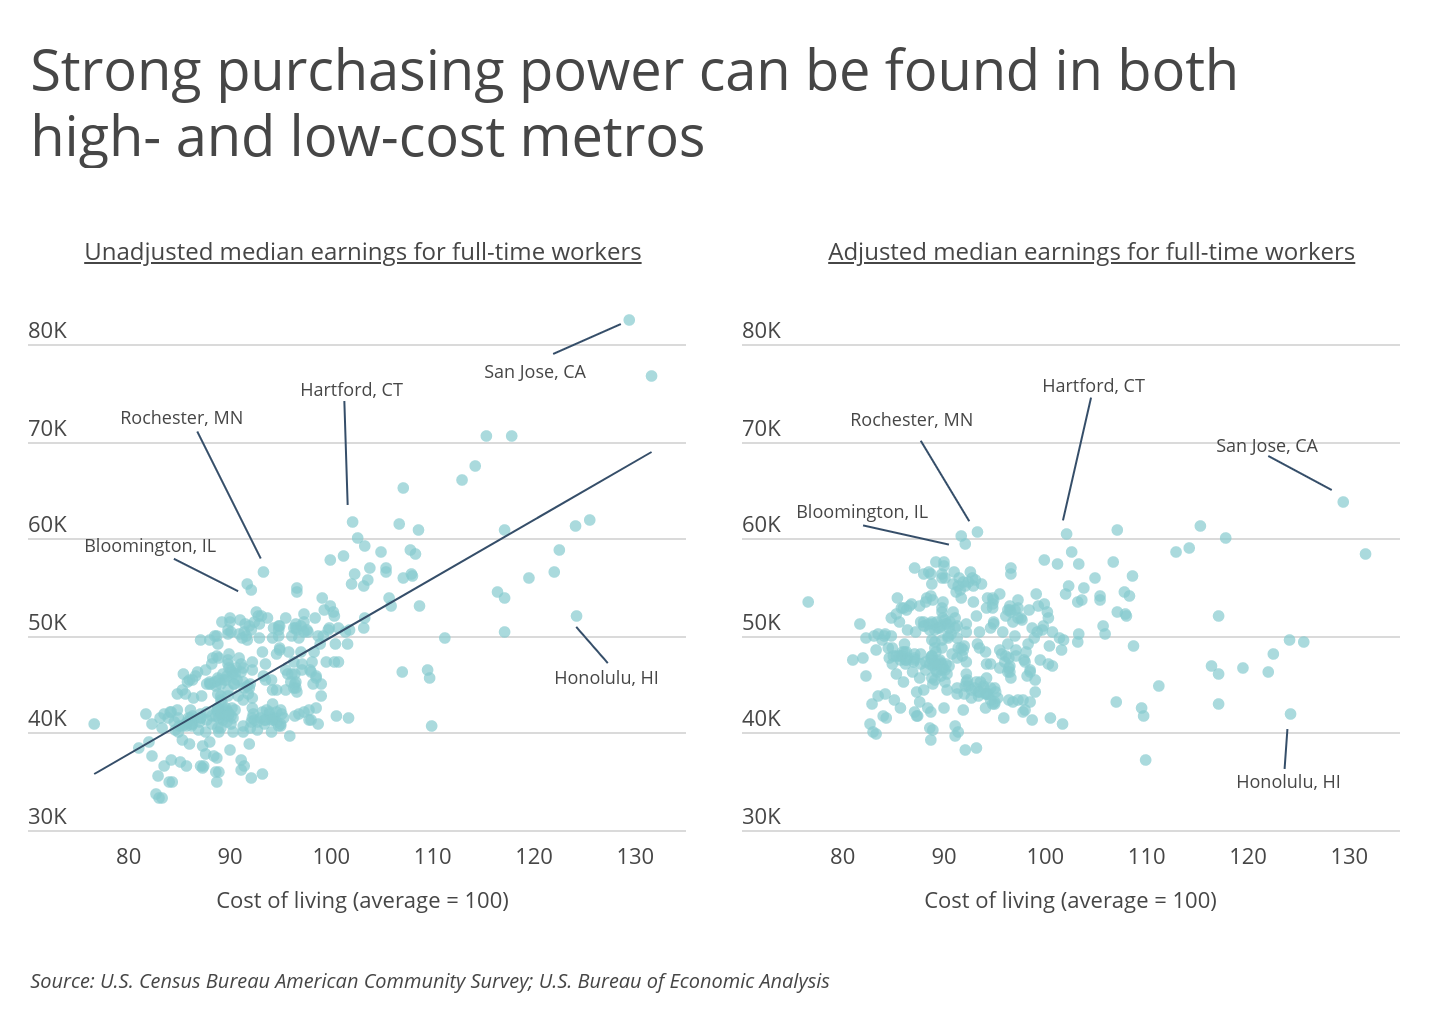
While unadjusted wages are generally higher in more expensive locations, cost-of-living adjusted wages show no significant correlation with living costs. This means that there are both highly expensive and highly affordable metropolitan areas offering strong purchasing power for its workers.
In general, the more expensive metros with strong purchasing power tend to be located in coastal areas, while the more affordable metros with strong purchasing power are located in the Midwest. Furthermore, the normalization of remote work during COVID-19 could have broader implications for where Americans want to live and work if many are no longer tethered to an employer’s office.
Earnings statistics used in the study are for full-time workers, retrieved from the U.S. Census Bureau 2019 and 2010 American Community Survey 1-Year Estimates. Cost-of-living statistics are from the U.S. Bureau of Economic Analysis Regional Price Parities.
To determine the locations with the highest and lowest cost-of-living adjusted earnings for full-time workers, median earnings were adjusted using the Regional Price Parity for that location. Earnings in locations with above-average living costs were adjusted down to reflect lower purchasing power, while earnings in locations with below-average living costs were adjusted up to reflect greater purchasing power.
All locations were ranked by their cost-of-living adjusted earnings for full-time workers. Only metros with at least 100,000 people and available data from both the Census Bureau and Bureau of Economic Analysis were included. To improve relevance, metros were grouped into cohorts based on population: small (100,000–349,999), midsize (350,000–999,999), and large (1,000,000 or more).
By clicking the above links, you will go to one of our insurance partners. The specific companies listed above may not be included in our partner's network at this time.