American Cities With the Most Minority Business Owners in 2022
America’s population of racial and ethnic minorities is growing faster than ever, poising nonwhite Americans to be an increasingly large force in the U.S. economy.
The results of the most recent decennial Census released last year showed divergent population trends for America’s white and nonwhite populations. While white Americans still represent a majority of the population, the number of Americans identifying as white alone declined by 8.6% from 2010 to 2020, while every other racial group saw increases in population over the same period. And this rapid growth is poised to continue: estimates project that the U.S. will become “majority minority” by the end of the 2040s.
Racial and ethnic minorities are playing a greater role in the economy as America’s nonwhite population grows. Minority business enterprises have accounted for more than half of the new businesses created in the U.S. over the last decade, creating 4.7 million jobs in the process.
But minority entrepreneurs still face numerous barriers to success. Minorities have a more difficult time obtaining capital from external investors or lenders, which limits their ability to start and grow businesses. Minority owners are also less likely to have access to mentors and professional networks that can advise them effectively on business decisions. In addition to these structural barriers, the COVID-19 pandemic was also particularly hard on minority-owned businesses. Minority-owned enterprises were more likely to face financial challenges, have decreased sales, reduce their operations, and have limited access to credit and federal relief funds.
RELATED
Many small businesses in the U.S. are underinsured. Regardless of the industry, it is important to have the right small business insurance for your needs.
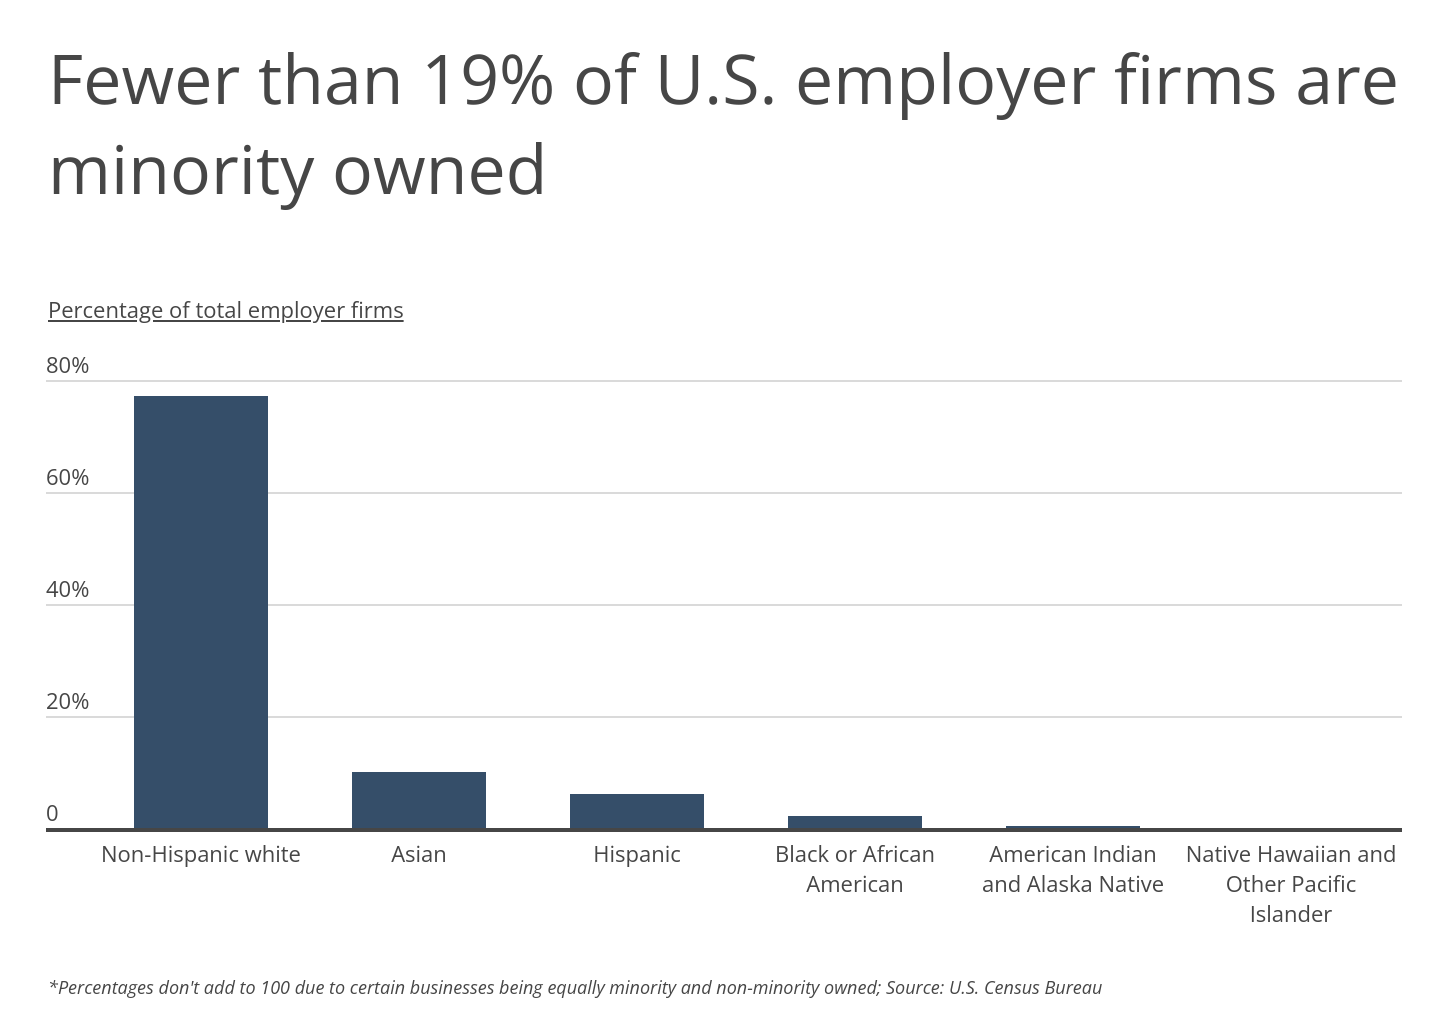
Nearly four out of five employer firms in the U.S. are owned by people identifying as non-Hispanic white, while only 19% of businesses are owned by minorities. However, the total share of minority-owned businesses does not capture the full picture of minority underrepresentation among business owners. White Americans own 77% of businesses despite only representing 60% of the population. In contrast, other groups own a disproportionately low share of businesses. Hispanic individuals represent over 18% of the U.S. total with only 6% of businesses being Hispanic-owned, while Black Americans are over 12% of the population but 2.3% of businesses are Black-owned.
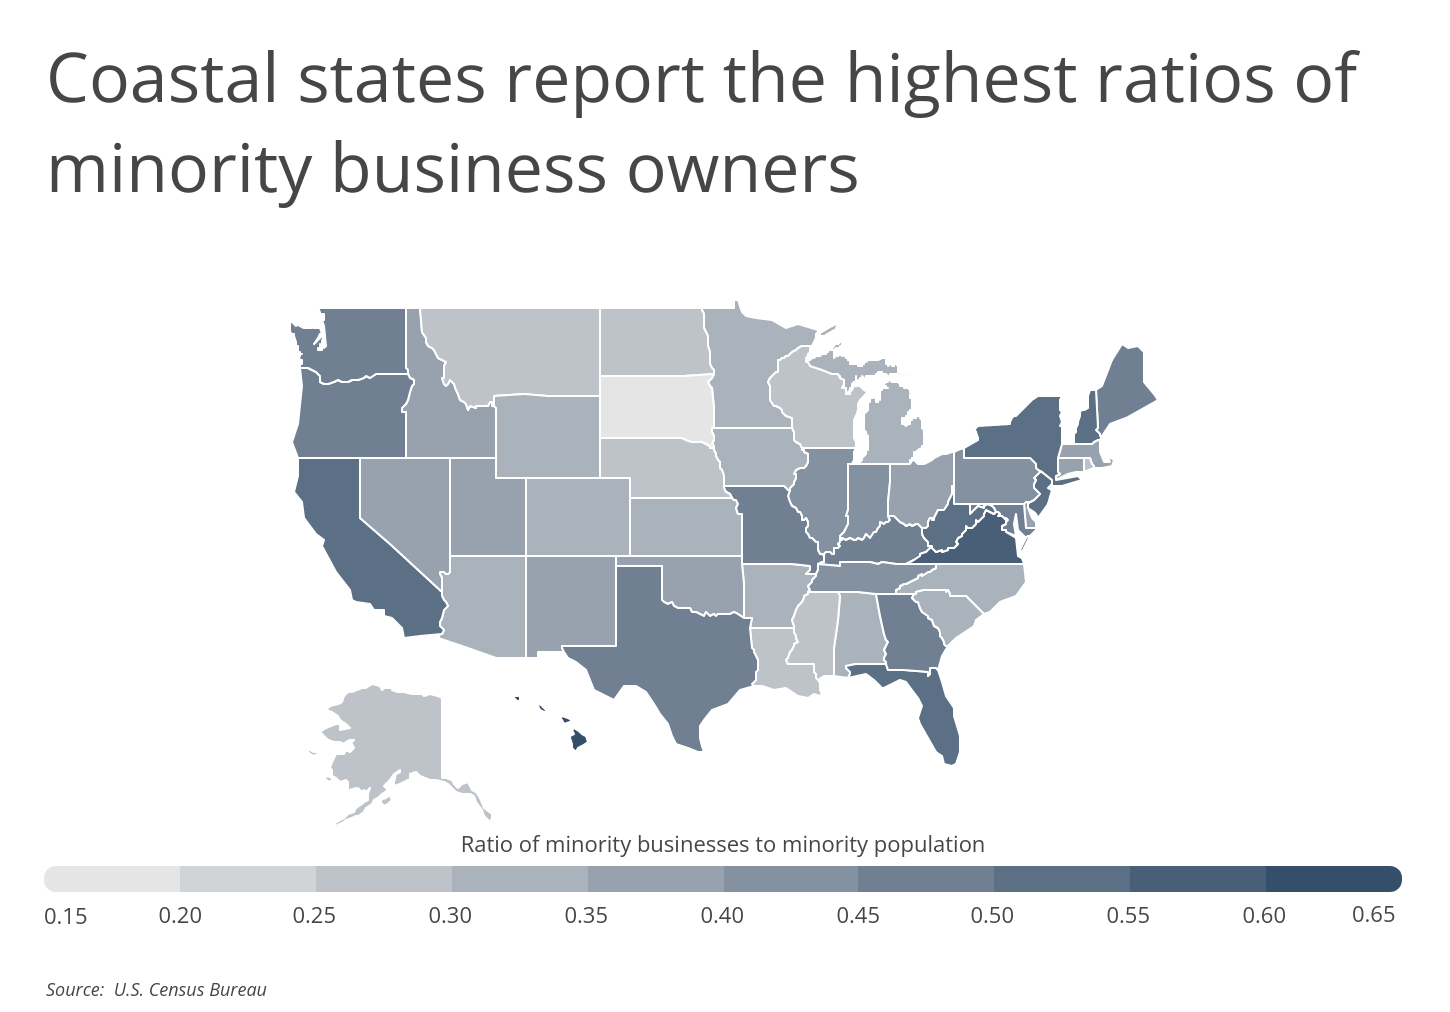
The ratio of minority-owned businesses and minority population varies across the country. It appears that minority population by itself is not a strong indicator of minority business activity. There are high ratios of minority business ownership among high minority states like Hawaii and low minority population states like West Virginia; there are likewise low ratios for high minority population Mississippi and low minority population South Dakota.
FOR SMALL BUSINESS OWNERS
Businesses that manufacture a physical product should get a product liability insurance quote to determine the right amount of coverage for their situation. On the other hand, businesses that provide a service should consider business professional liability insurance.
Two factors that do appear to affect the ratio in different locations are immigration and education. Many nonwhite entrepreneurs are also immigrants, who by some estimates are 80% more likely to start a business than people born in the U.S., and immigrant-heavy states like Florida, California, and New York have higher than usual levels of minority business activity. A majority of entrepreneurs have college degrees, and states where minorities have higher rates of educational attainment, including Virginia and Maryland, are also toward the top of the list for minority entrepreneurship. At the local level, many of the metros with more minority-owned businesses are found in these leading states.
The data in this analysis was sourced from the U.S. Census Bureau’s Annual Business Survey and American Community Survey. To determine the locations with the most minority business owners, researchers at Smartest Dollar calculated the ratio of minority-owned businesses to the minority population. This was done by taking the percentage of businesses that are minority owned and dividing it by the minority population share. The researchers also calculated the percentage of total employment and total payroll at minority firms as well.
Here are the metropolitan areas with the most minority business owners.
Large Metros With the Most Minority Business Owners
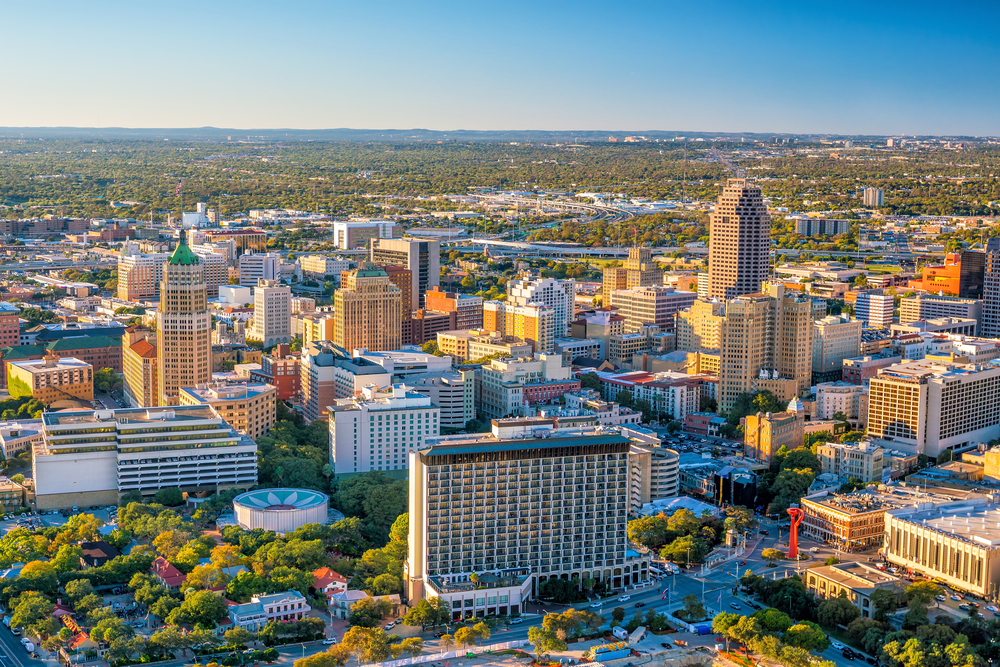
Photo Credit: f11photo / Shutterstock
15. San Antonio-New Braunfels, TX
- Ratio of minority businesses to minority population: 0.44
- Percentage of businesses that are minority owned: 29.4%
- Minority population share: 66.8%
- Percentage of total employment at minority businesses: 11.4%
- Percentage of total payroll at minority businesses: 7.3%

Photo Credit: f11photo / Shutterstock
14. Baltimore-Columbia-Towson, MD
- Ratio of minority businesses to minority population: 0.45
- Percentage of businesses that are minority owned: 20.2%
- Minority population share: 44.5%
- Percentage of total employment at minority businesses: 8.6%
- Percentage of total payroll at minority businesses: 5.7%

Photo Credit: f11photo / Shutterstock
13. Dallas-Fort Worth-Arlington, TX
- Ratio of minority businesses to minority population: 0.46
- Percentage of businesses that are minority owned: 25.1%
- Minority population share: 55.1%
- Percentage of total employment at minority businesses: 9.7%
- Percentage of total payroll at minority businesses: 5.9%

Photo Credit: Sean Pavone / Shutterstock
12. Richmond, VA
- Ratio of minority businesses to minority population: 0.47
- Percentage of businesses that are minority owned: 20.1%
- Minority population share: 43.0%
- Percentage of total employment at minority businesses: 7.3%
- Percentage of total payroll at minority businesses: 4.0%

Photo Credit: Sean Pavone / Shutterstock
11. St. Louis, MO-IL
- Ratio of minority businesses to minority population: 0.48
- Percentage of businesses that are minority owned: 12.7%
- Minority population share: 26.6%
- Percentage of total employment at minority businesses: 4.0%
- Percentage of total payroll at minority businesses: 2.3%

Photo Credit: f11photo / Shutterstock
10. Seattle-Tacoma-Bellevue, WA
- Ratio of minority businesses to minority population: 0.48
- Percentage of businesses that are minority owned: 18.4%
- Minority population share: 38.3%
- Percentage of total employment at minority businesses: 6.3%
- Percentage of total payroll at minority businesses: 3.7%

Photo Credit: Sean Pavone / Shutterstock
9. New York-Newark-Jersey City, NY-NJ-PA
- Ratio of minority businesses to minority population: 0.48
- Percentage of businesses that are minority owned: 26.3%
- Minority population share: 54.9%
- Percentage of total employment at minority businesses: 9.8%
- Percentage of total payroll at minority businesses: 5.3%

Photo Credit: Jon Bilous / Shutterstock
8. Portland-Vancouver-Hillsboro, OR-WA
- Ratio of minority businesses to minority population: 0.48
- Percentage of businesses that are minority owned: 13.3%
- Minority population share: 27.7%
- Percentage of total employment at minority businesses: 6.1%
- Percentage of total payroll at minority businesses: 3.4%

Photo Credit: Songquan Deng / Shutterstock
7. Orlando-Kissimmee-Sanford, FL
- Ratio of minority businesses to minority population: 0.49
- Percentage of businesses that are minority owned: 26.8%
- Minority population share: 54.8%
- Percentage of total employment at minority businesses: 7.0%
- Percentage of total payroll at minority businesses: 4.5%

Photo Credit: Bonnie Fink / Shutterstock
6. Tampa-St. Petersburg-Clearwater, FL
- Ratio of minority businesses to minority population: 0.49
- Percentage of businesses that are minority owned: 19.0%
- Minority population share: 38.6%
- Percentage of total employment at minority businesses: 7.9%
- Percentage of total payroll at minority businesses: 5.7%

Photo Credit: Jon Bilous / Shutterstock
5. Riverside-San Bernardino-Ontario, CA
- Ratio of minority businesses to minority population: 0.49
- Percentage of businesses that are minority owned: 34.2%
- Minority population share: 69.3%
- Percentage of total employment at minority businesses: 15.5%
- Percentage of total payroll at minority businesses: 12.7%

Photo Credit: Sean Pavone / Shutterstock
4. Houston-The Woodlands-Sugar Land, TX
- Ratio of minority businesses to minority population: 0.50
- Percentage of businesses that are minority owned: 32.2%
- Minority population share: 64.9%
- Percentage of total employment at minority businesses: 12.4%
- Percentage of total payroll at minority businesses: 6.4%

Photo Credit: Chones / Shutterstock
3. Los Angeles-Long Beach-Anaheim, CA
- Ratio of minority businesses to minority population: 0.52
- Percentage of businesses that are minority owned: 36.6%
- Minority population share: 70.8%
- Percentage of total employment at minority businesses: 17.3%
- Percentage of total payroll at minority businesses: 11.4%

Photo Credit: f11photo / Shutterstock
2. Washington-Arlington-Alexandria, DC-VA-MD-WV
- Ratio of minority businesses to minority population: 0.57
- Percentage of businesses that are minority owned: 31.4%
- Minority population share: 55.3%
- Percentage of total employment at minority businesses: 13.0%
- Percentage of total payroll at minority businesses: 8.9%

Photo Credit: Sundry Photography / Shutterstock
1. San Jose-Sunnyvale-Santa Clara, CA
- Ratio of minority businesses to minority population: 0.61
- Percentage of businesses that are minority owned: 42.3%
- Minority population share: 69.5%
- Percentage of total employment at minority businesses: 13.7%
- Percentage of total payroll at minority businesses: 6.4%
Methodology & Detailed Findings
The data in this analysis was sourced from the U.S. Census Bureau’s Annual Business Survey and American Community Survey. To determine the locations with the most minority business owners, researchers at Smartest Dollar calculated the ratio of minority-owned businesses to the minority population. This was done by taking the percentage of businesses that are minority owned-defined by having a “race code” of “minority”-and dividing it by the minority population share. For the purpose of this analysis, a person was considered to be a member of a minority group if they were not non-Hispanic white. The researchers also calculated the percentage of total employment at minority firms and the percentage of total payroll at minority businesses. To improve relevance, only metropolitan areas with at least 100,000 residents were included. Additionally, metros were grouped into size-based cohorts: small (100,000–349,999), midsize (350,000–999,999), and large (1,000,000 or more). Data that did not satisfy the U.S. Census Bureau’s publication standards were excluded.
By clicking the above links, you will go to one of our insurance partners. The specific companies listed above may not be included in our partner's network at this time.