U.S. Cities Most Dependent on Small Businesses [2022 Edition]
Small businesses are the heart of the U.S. economy. Small businesses represent 99.9% of all businesses in the U.S., collectively employing nearly half of all U.S. employees and generating nearly half of U.S. annual GDP, according to data from the U.S. Small Business Administration.
But the past two years have been treacherous for many small businesses. The initial shock of the COVID-19 pandemic disrupted many businesses, leading 43% to close at least temporarily and producing 9.1 million job losses in the first two quarters of 2020. Government support like the Paycheck Protection Program allowed businesses to weather the crisis, but challenges remain. Labor market tightness over the last year has made it difficult to recruit and retain talent and driven wages upward. Supply chain issues and inflation have made it harder to obtain materials and manage costs. And with interest rates on the rise and investors becoming more cautious amid fears of a recession, capital to start or grow a business is likely to be harder to come by in the months and years ahead.
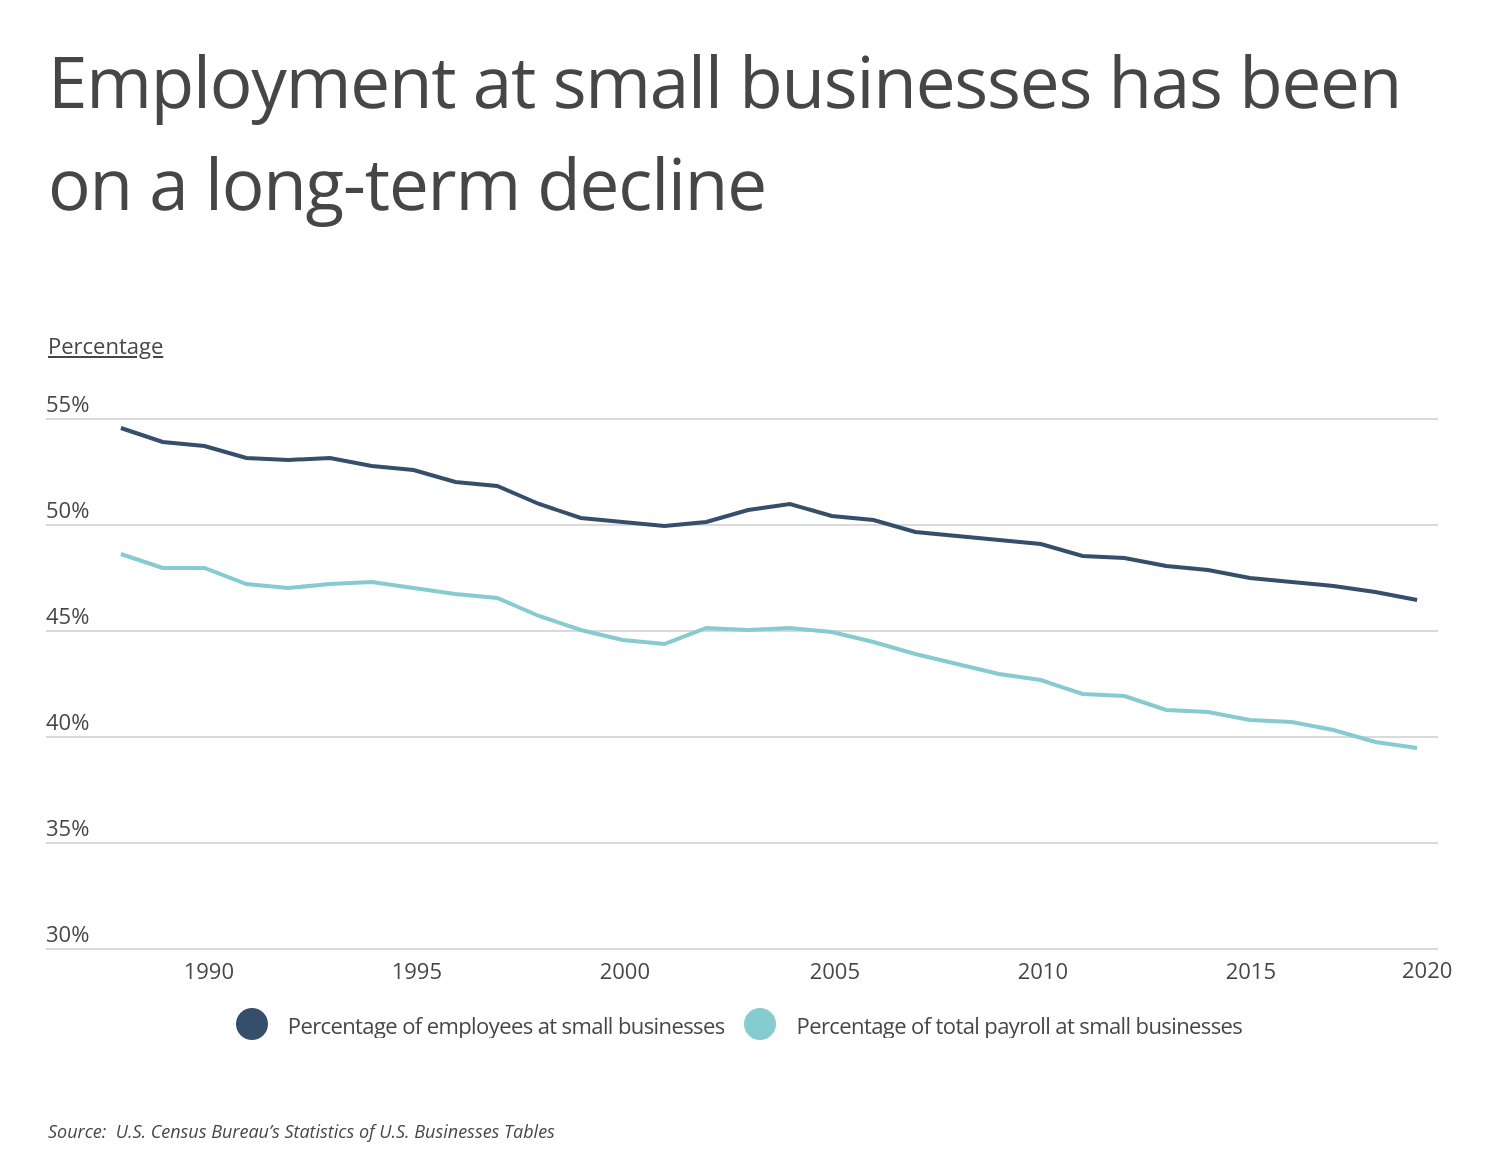
While recent conditions have been uniquely challenging for small business, the role of small business in the economy has been on a decline for several decades. In the late 1980s, small businesses-defined here as those employing between one and 499 workers-employed 54.5% of working Americans and were responsible for 48.6% of payrolls. Today those figures are 46.4% and 39.4%, even though the overall percentage of firms defined as a small business has held steady over the same span.
FOR SMALL BUSINESS OWNERS
Nearly half of U.S. small business owners have either been involved with or threatened by a civil lawsuit. Fortunately, choosing one of the best general liability insurance or business owners insurance policies will cover you from a wide range of legal risks.
One reason for this decline is the growing concentration of larger firms over time. With the market power to crowd out smaller competitors and more resources to invest, large firms have grown both their position with consumers and their strength in labor markets.
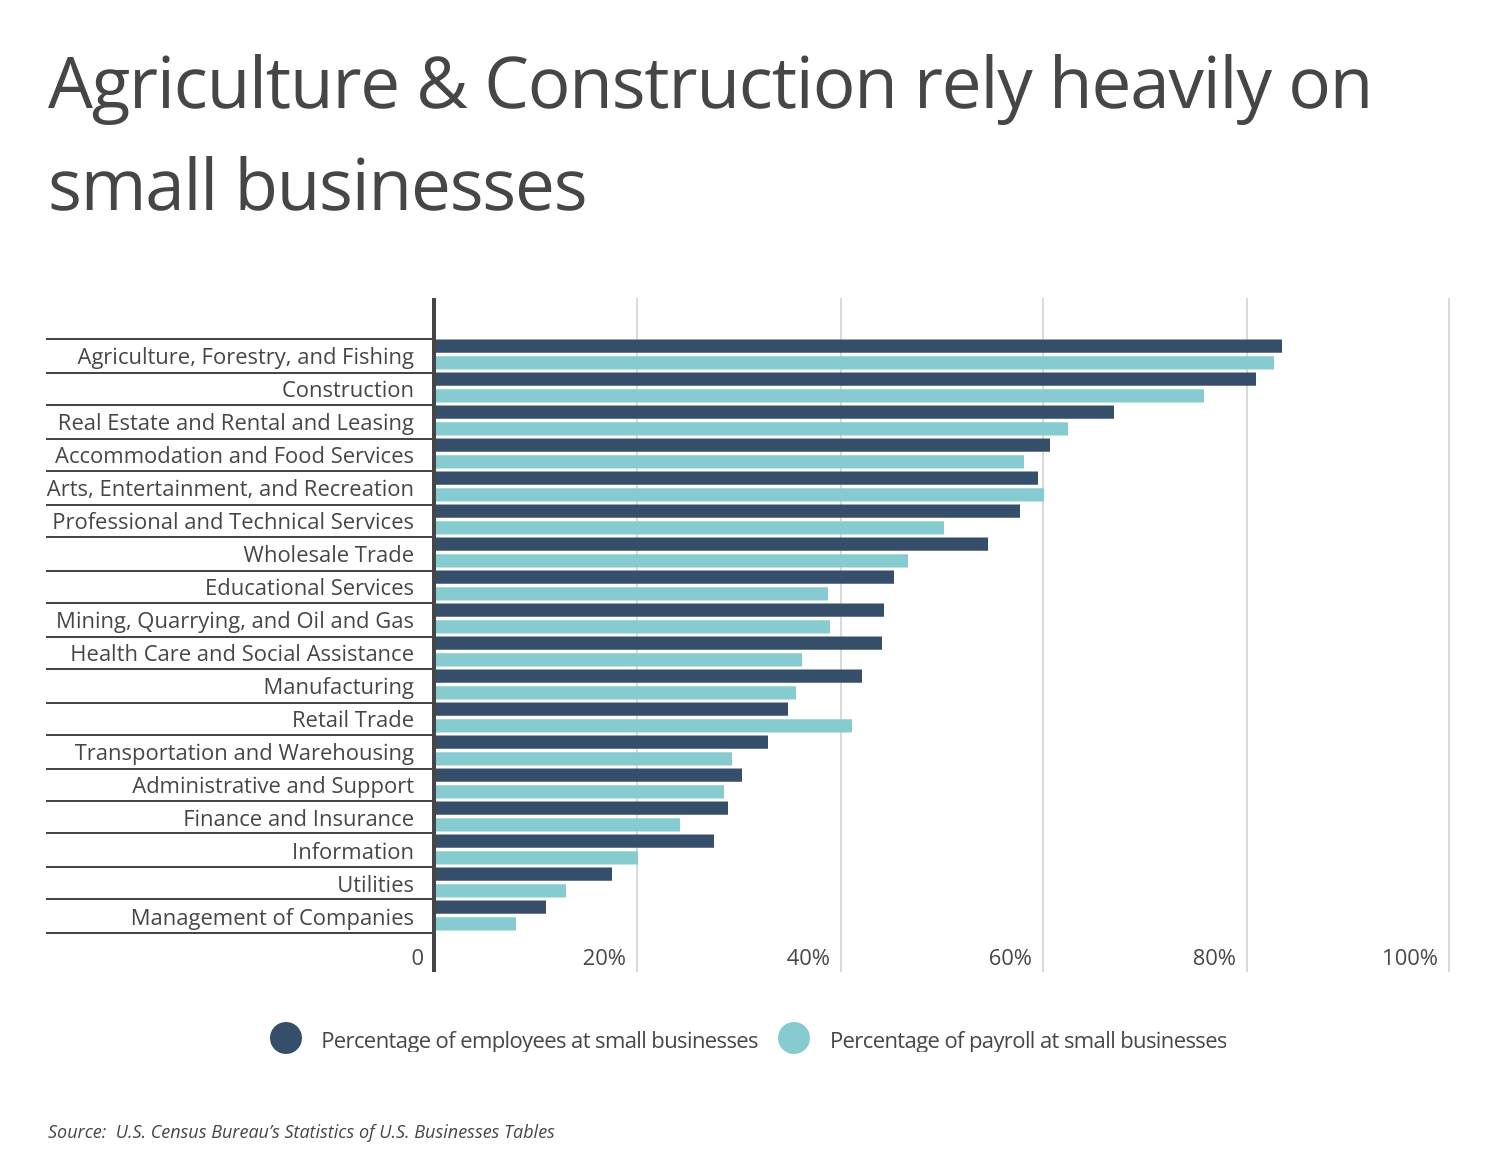
However, the presence of small businesses and large firms varies by industry. Highly concentrated industries like finance and insurance and utilities have lower percentages of employees and payrolls at small businesses. In contrast, businesses in agriculture and construction each have more than 80% of employees and 75% of payrolls at small businesses.
RELATED
As the U.S. economy has evolved, two increasingly common lawsuits against businesses are those related to employment practices and cyber security. Our recently updated guides on employment practices liability insurance and cyber liability insurance explain everything you need to know.
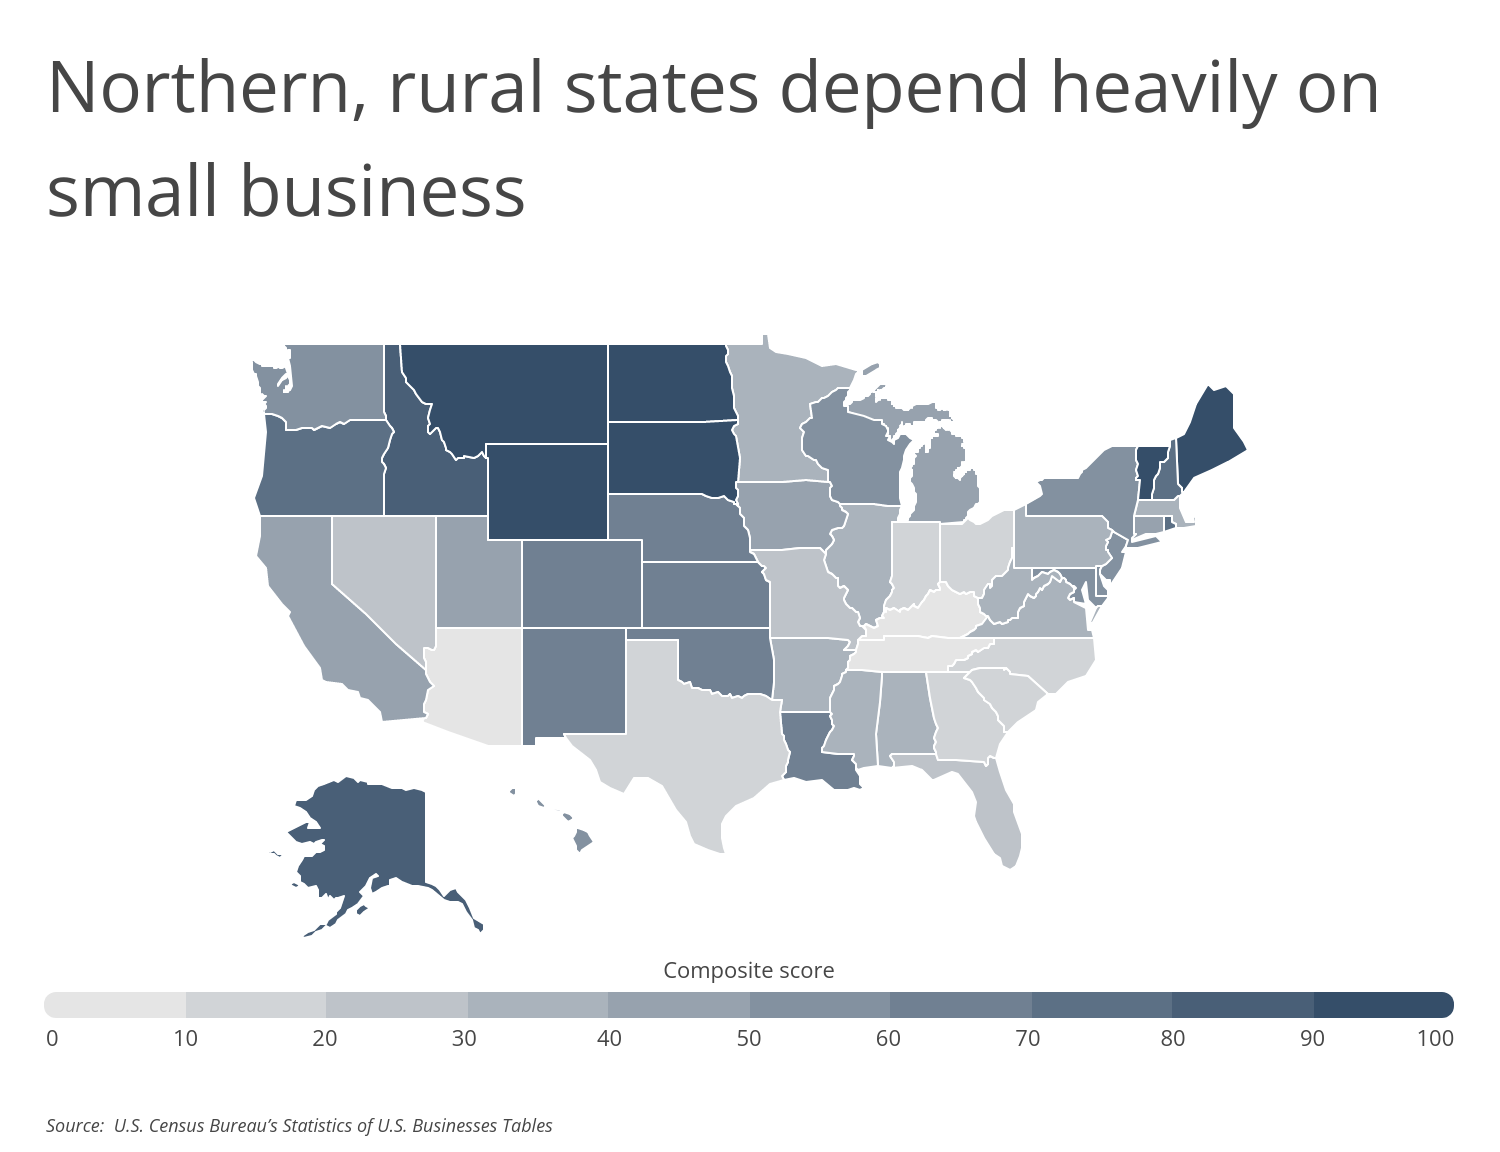
Small businesses’ role in the economy can also vary by location. Perhaps unsurprisingly, most of the states with the highest dependence on small businesses for employment are among the least populous. The leading states are rural, sparsely populated locations in the central U.S., like Montana, Wyoming, and South Dakota, and in New England, like Vermont and Maine.
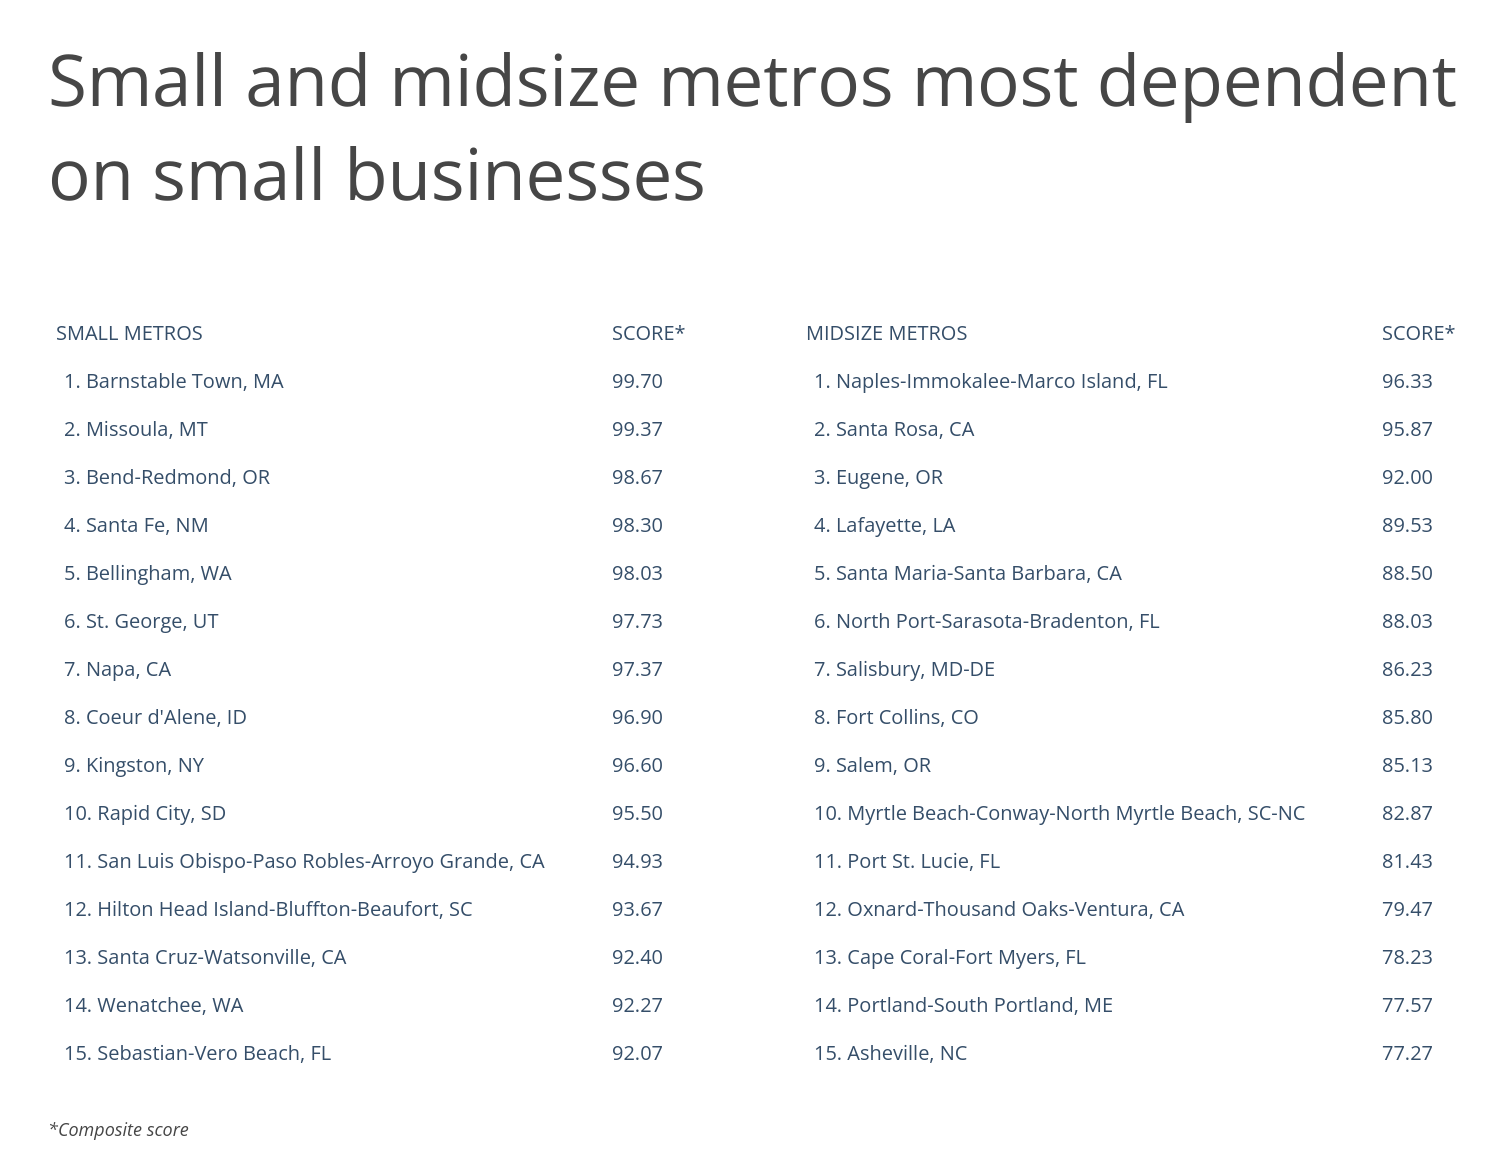
At the metro level, other factors could explain a city’s dependence on small business. Some top cities, like Austin and San Francisco, have strong startup ecosystems that encourage small business development. Others are Rust Belt locations like Buffalo and Grand Rapids, where major industrial presences of old have ceased or reduced operations and left more room for small businesses to flourish. And some leaders, including Los Angeles and Miami, have high populations of racial or ethnic minorities and immigrants, two groups that are more likely to start small businesses.
The data used in this analysis is from the U.S. Census Bureau’s Statistics of U.S. Businesses Tables. To determine the locations most dependent on small businesses, researchers at Smartest Dollar-a review website for professional liability insurance and other commercial insurance policies-calculated a composite score based on the percentage of employees at small businesses, the percentage of total payroll at small businesses, and the number of small businesses per 10,000 people. In the event of a tie, the location with the greater percentage of employees at small businesses was ranked higher.
Here are the U.S. metropolitan areas most dependent on small business.
Large Metros Most Dependent on Small Businesses

Photo Credit: ShengYing Lin / Shutterstock
15. Austin-Round Rock, TX
- Composite score: 48.87
- Percentage of employees at small businesses: 48.4%
- Percentage of total payroll at small businesses: 40.6%
- Small businesses per 10k people: 189.7
- Total number of small businesses with employees: 43,551
- Total employees at small businesses: 434,122
- Total annual payroll at small businesses: $22,136,221,000

Photo Credit: Pete Niesen / Shutterstock
14. San Francisco-Oakland-Hayward, CA
- Composite score: 51.03
- Percentage of employees at small businesses: 49.7%
- Percentage of total payroll at small businesses: 36.5%
- Small businesses per 10k people: 227.8
- Total number of small businesses with employees: 106,989
- Total employees at small businesses: 1,134,646
- Total annual payroll at small businesses: $83,169,809,000

Photo Credit: ESB Professional / Shutterstock
13. Baltimore-Columbia-Towson, MD
- Composite score: 53.97
- Percentage of employees at small businesses: 48.5%
- Percentage of total payroll at small businesses: 43.1%
- Small businesses per 10k people: 187.2
- Total number of small businesses with employees: 52,418
- Total employees at small businesses: 584,058
- Total annual payroll at small businesses: $30,463,291,000

Photo Credit: Matt Gush / Shutterstock
12. Fresno, CA
- Composite score: 54.03
- Percentage of employees at small businesses: 52.7%
- Percentage of total payroll at small businesses: 51.7%
- Small businesses per 10k people: 136.0
- Total number of small businesses with employees: 13,615
- Total employees at small businesses: 146,318
- Total annual payroll at small businesses: $6,478,226,000

Photo Credit: Andrei Medvedev / Shutterstock
11. Washington-Arlington-Alexandria, DC-VA-MD-WV
- Composite score: 57.70
- Percentage of employees at small businesses: 49.2%
- Percentage of total payroll at small businesses: 44.2%
- Small businesses per 10k people: 187.6
- Total number of small businesses with employees: 118,633
- Total employees at small businesses: 1,359,594
- Total annual payroll at small businesses: $86,002,592,000

Photo Credit: Sergey Novikov / Shutterstock
10. Buffalo-Cheektowaga-Niagara Falls, NY
- Composite score: 58.17
- Percentage of employees at small businesses: 49.2%
- Percentage of total payroll at small businesses: 44.5%
- Small businesses per 10k people: 187.1
- Total number of small businesses with employees: 21,061
- Total employees at small businesses: 241,452
- Total annual payroll at small businesses: $10,254,061,000

Photo Credit: kan khampanya / Shutterstock
9. San Diego-Carlsbad, CA
- Composite score: 59.87
- Percentage of employees at small businesses: 49.6%
- Percentage of total payroll at small businesses: 42.2%
- Small businesses per 10k people: 215.0
- Total number of small businesses with employees: 71,641
- Total employees at small businesses: 652,088
- Total annual payroll at small businesses: $34,234,372,000

Photo Credit: Victor Moussa / Shutterstock
8. New York-Newark-Jersey City, NY-NJ-PA
- Composite score: 60.27
- Percentage of employees at small businesses: 50.9%
- Percentage of total payroll at small businesses: 39.8%
- Small businesses per 10k people: 262.4
- Total number of small businesses with employees: 501,830
- Total employees at small businesses: 4,417,456
- Total annual payroll at small businesses: $257,566,762,000

Photo Credit: Henryk Sadura / Shutterstock
7. Grand Rapids-Wyoming, MI
- Composite score: 60.37
- Percentage of employees at small businesses: 50.2%
- Percentage of total payroll at small businesses: 47.9%
- Small businesses per 10k people: 179.5
- Total number of small businesses with employees: 19,411
- Total employees at small businesses: 257,668
- Total annual payroll at small businesses: $11,888,215,000

Photo Credit: Jon Bilous / Shutterstock
6. Portland-Vancouver-Hillsboro, OR-WA
- Composite score: 61.03
- Percentage of employees at small businesses: 51.0%
- Percentage of total payroll at small businesses: 41.2%
- Small businesses per 10k people: 226.7
- Total number of small businesses with employees: 56,914
- Total employees at small businesses: 552,890
- Total annual payroll at small businesses: $26,756,996,000

Photo Credit: Richard Cavalleri / Shutterstock
5. Providence-Warwick, RI-MA
- Composite score: 69.37
- Percentage of employees at small businesses: 51.7%
- Percentage of total payroll at small businesses: 47.2%
- Small businesses per 10k people: 205.9
- Total number of small businesses with employees: 33,432
- Total employees at small businesses: 332,357
- Total annual payroll at small businesses: $15,216,318,000

Photo Credit: Sean Pavone / Shutterstock
4. New Orleans-Metairie, LA
- Composite score: 71.17
- Percentage of employees at small businesses: 53.7%
- Percentage of total payroll at small businesses: 48.9%
- Small businesses per 10k people: 189.4
- Total number of small businesses with employees: 24,092
- Total employees at small businesses: 269,529
- Total annual payroll at small businesses: $12,389,281,000

Photo Credit: Natalia Bratslavsky / Shutterstock
3. Oklahoma City, OK
- Composite score: 72.07
- Percentage of employees at small businesses: 53.2%
- Percentage of total payroll at small businesses: 47.9%
- Small businesses per 10k people: 199.3
- Total number of small businesses with employees: 28,402
- Total employees at small businesses: 277,578
- Total annual payroll at small businesses: $11,683,681,000

Photo Credit: Chones / Shutterstock
2. Los Angeles-Long Beach-Anaheim, CA
- Composite score: 72.50
- Percentage of employees at small businesses: 51.8%
- Percentage of total payroll at small businesses: 45.9%
- Small businesses per 10k people: 249.5
- Total number of small businesses with employees: 327,093
- Total employees at small businesses: 2,818,026
- Total annual payroll at small businesses: $157,195,952,000

Photo Credit: May Lana / Shutterstock
1. Miami-Fort Lauderdale-West Palm Beach, FL
- Composite score: 78.17
- Percentage of employees at small businesses: 53.1%
- Percentage of total payroll at small businesses: 47.6%
- Small businesses per 10k people: 278.9
- Total number of small businesses with employees: 172,172
- Total employees at small businesses: 1,209,509
- Total annual payroll at small businesses: $56,113,986,000
Detailed Findings & Methodology
The data used in this analysis is from the U.S. Census Bureau’s Statistics of U.S. Businesses Tables. To determine the locations most dependent on small businesses, researchers calculated a composite score based on the following measures, weighted equally:
- Percentage of employees at small businesses
- Percentage of total payroll at small businesses
- Small businesses per 10k people
In the event of a tie, the location with the greater percentage of employees at small businesses was ranked higher. To improve relevance, only metropolitan areas with at least 100,000 residents were included. Additionally, metros were grouped into cohorts based on population size: small (100,000–349,999), midsize (350,000–999,999), and large (1,000,000 or more). Note, the definition of small businesses is employer firms with fewer than 500 employees.
By clicking the above links, you will go to one of our insurance partners. The specific companies listed above may not be included in our partner's network at this time.