Best-Paying U.S. Cities for Women in 2023
Americans’ relationship to work has changed dramatically in the three years since the COVID-19 pandemic began. The transition to remote and hybrid work arrangements has become commonplace throughout corporate America. The Great Resignation saw millions of people switch jobs and career paths in search of better pay or working conditions. And many Americans left the workforce altogether: the labor force participation rate today continues to lag its levels from early 2020.
These shifts have affected workers of all types, but women in particular have been navigating the new dynamics of work. More women these days are considering leaving their companies for more flexible arrangements like hybrid work. However, this choice can in some cases be disadvantageous-both for women, who may miss out on opportunities for career advancement, and for employers, who lose out on talent when female employees depart.
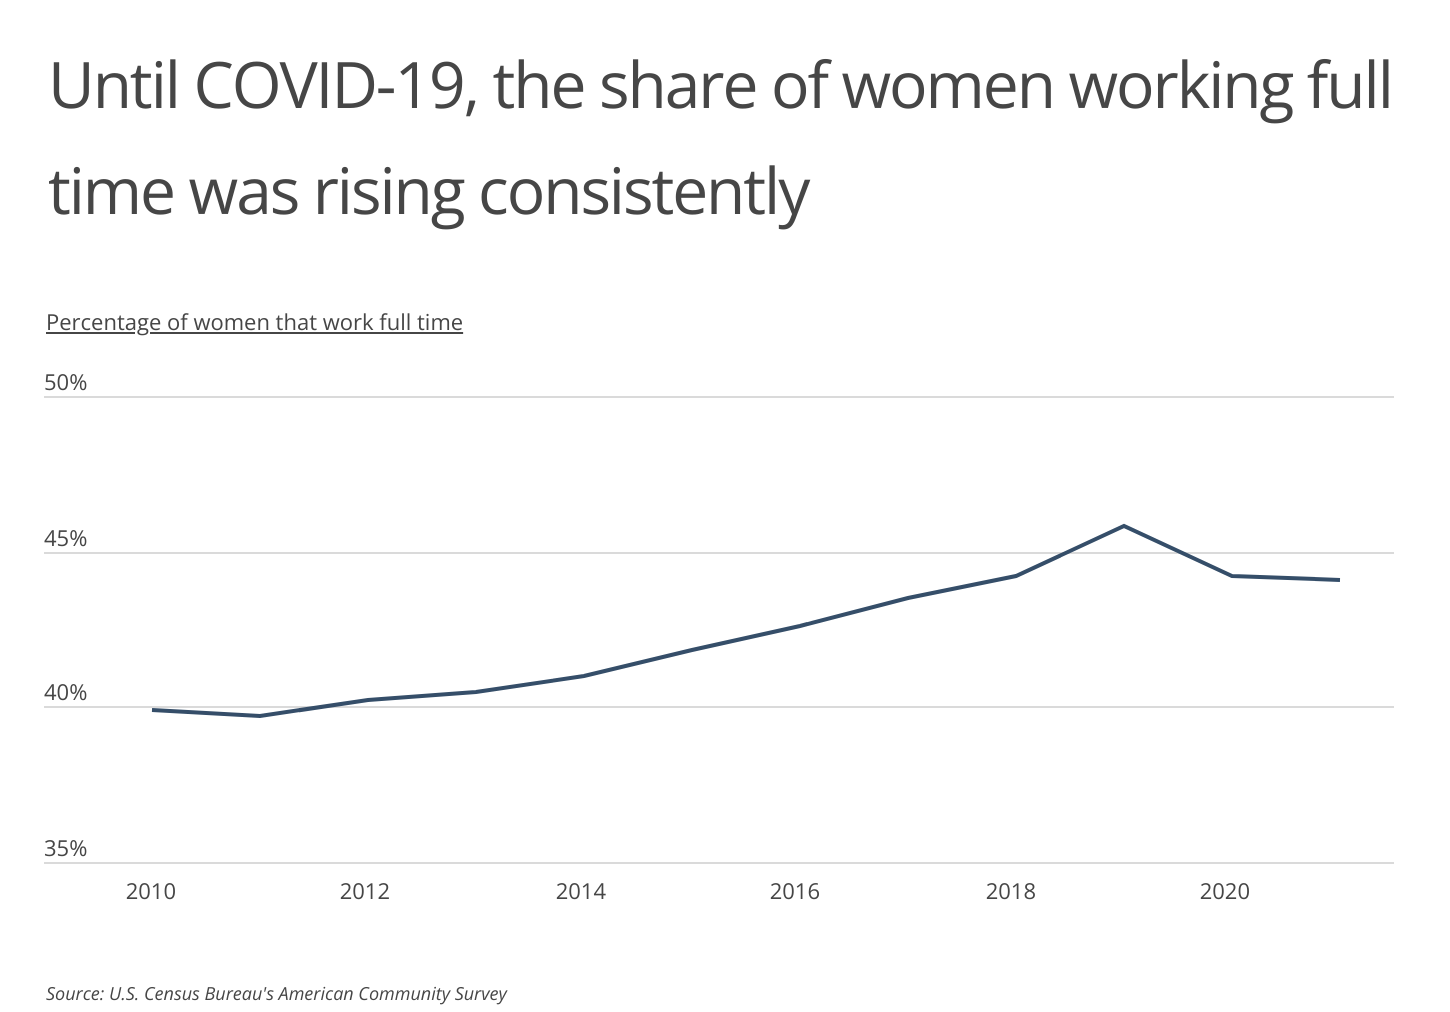
The share of women working full time has also been on the decline in the last few years. This figure had been growing steadily since 2011, reaching a peak of 45.8% in 2019 before falling to 44.1% two years later. One primary reason for the decline is that family caregiving responsibilities often fall on the shoulders of women. During the pandemic, when many schools were still using remote learning and child care was unreliable, those burdens increased, and many women left the workforce to care for children.
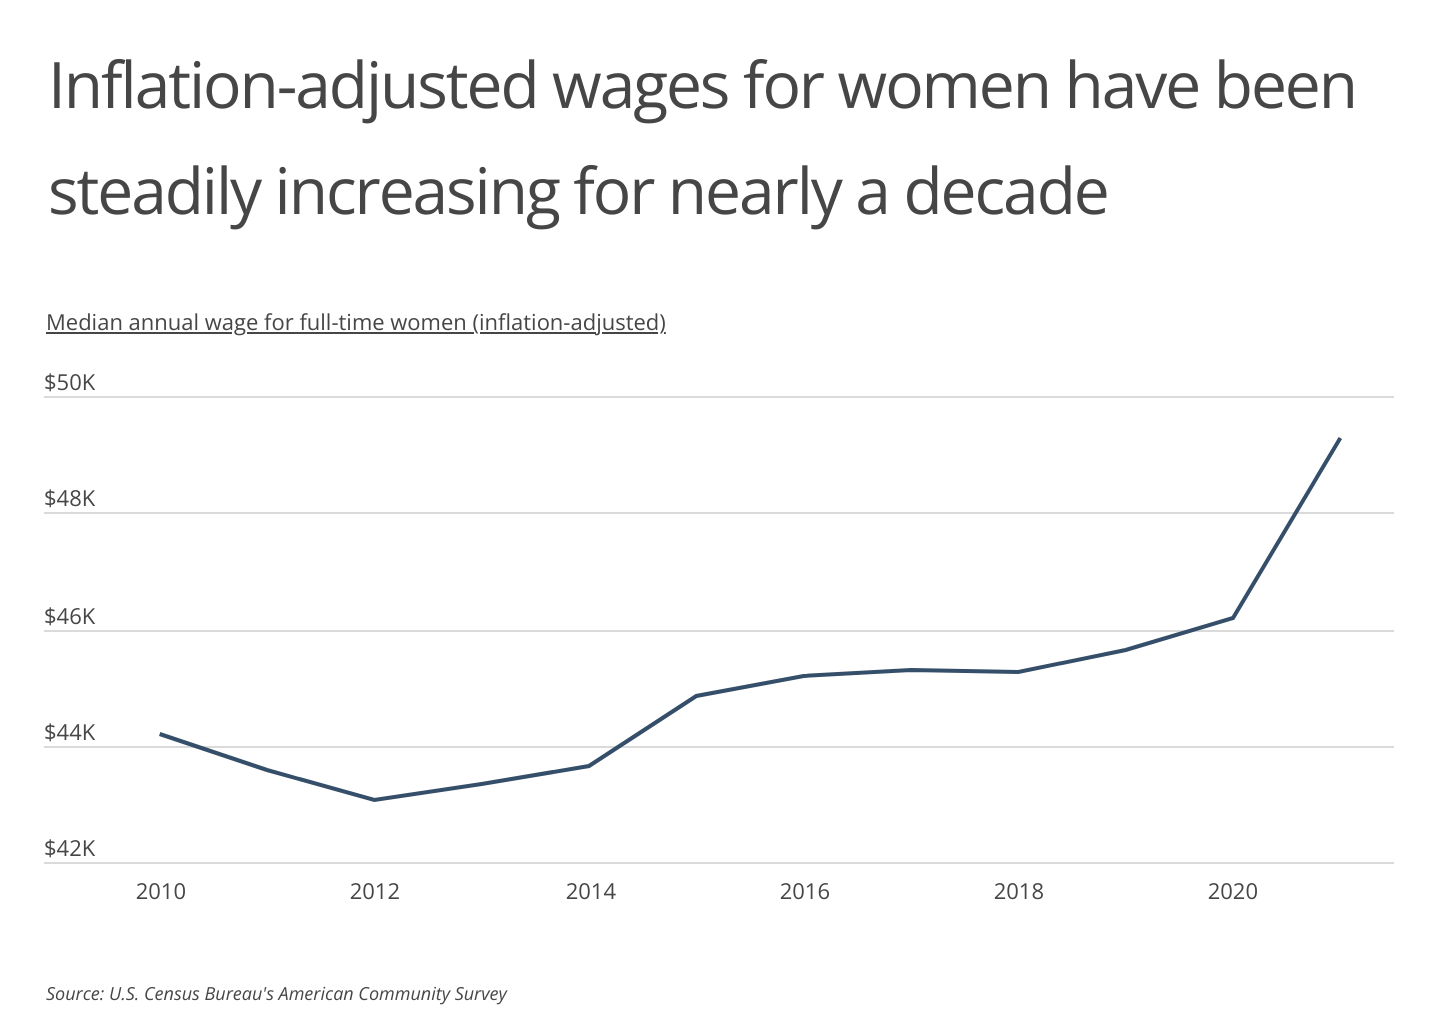
For women who have continued in the workforce, however, wage growth has accelerated in recent years. Inflation-adjusted wages for women working full time have been steadily increasing over the last decade. In 2012, women had a median inflation-adjusted wage of $43,074. That figure had increased to $46,196 by 2020, and in 2021 alone, women’s median wages jumped 6.6% to $49,263. Meanwhile, median wages for men saw a similar jump from $56,751 in 2020 to $60,428 in 2021-an increase of 6.5%. As a result, the wage gap between full-time female and male workers remained steady at approximately 18.5%.
FOR BUSINESS OWNERS
Even though the company itself may be protected from some legal action during bankruptcy, its executives may still be faced with personal risk. D&O insurance can provide the company’s directors and officers with additional protection. Here’s what you need to know about D&O insurance and the best D&O insurance companies.
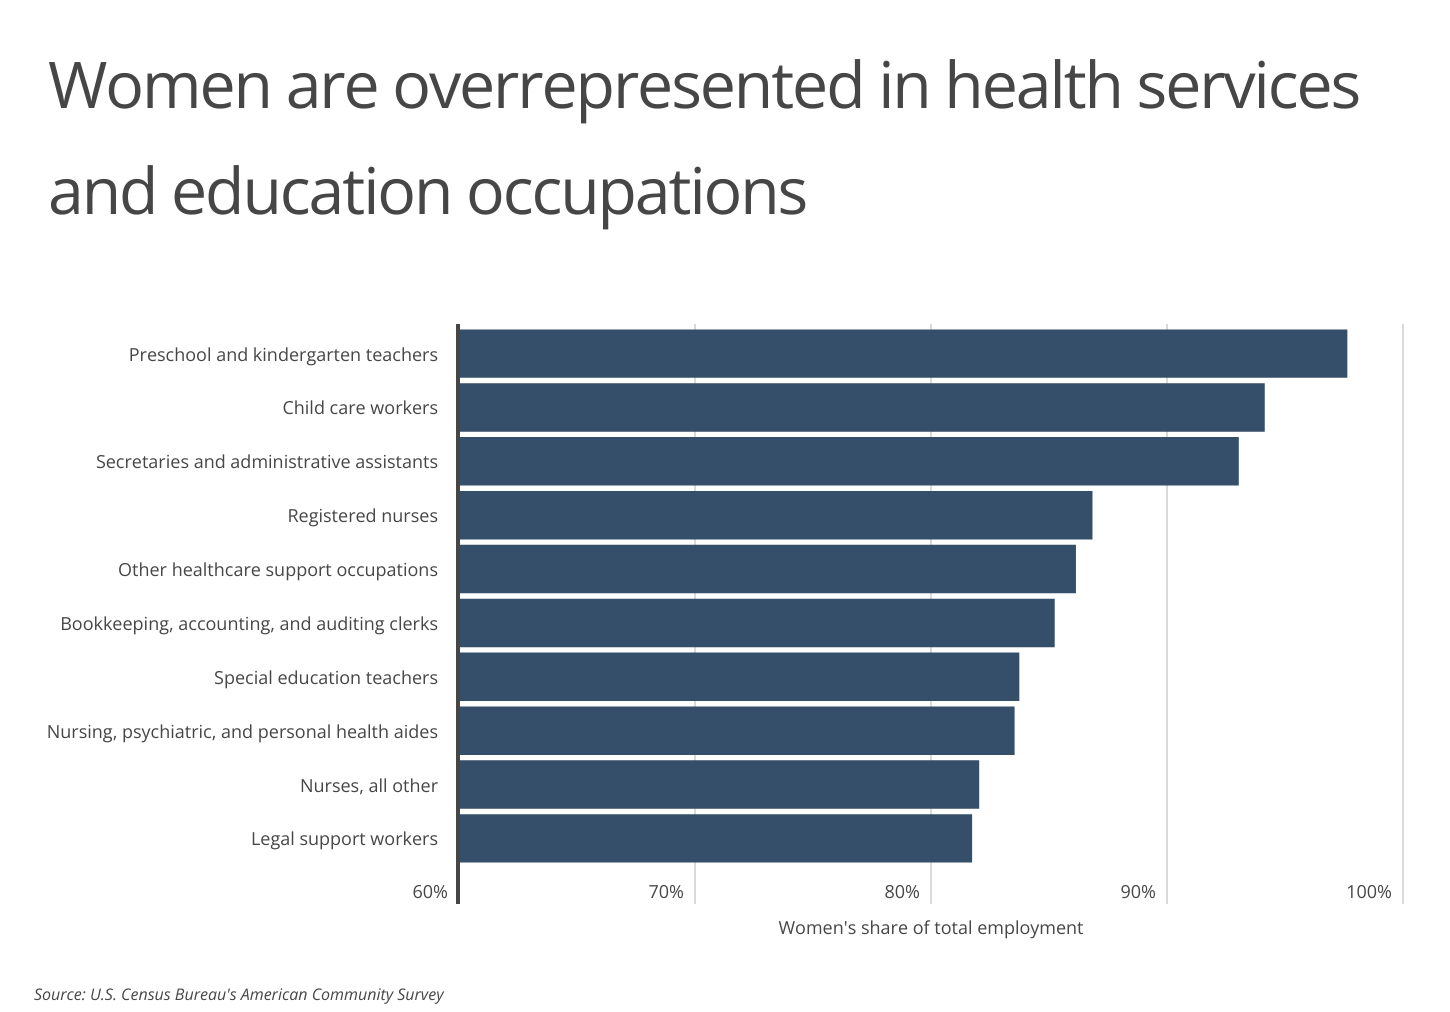
This wage growth has taken place despite the fact that many of the occupations with the highest concentration of female workers pay relatively little compared to other professions. Health services and education jobs are overwhelmingly filled by women, and women are also overrepresented in clerical roles like administrative assistants, clerks, and legal support workers. While some occupations in these fields, like registered nurses, deliver good wages, many others pay below the national median. For example, more than nine in 10 preschool teachers are women, and they typically earn $30,210 per year.
LEARN MORE
Does your business collect and store personally identifiable information of clients or customers in the regular course of business, such as social security numbers, phone numbers, and email addresses? You might want to consider cyber insurance-designed to protect businesses (and individuals) from liability related to cyber attacks that compromise the personal information of your customers.
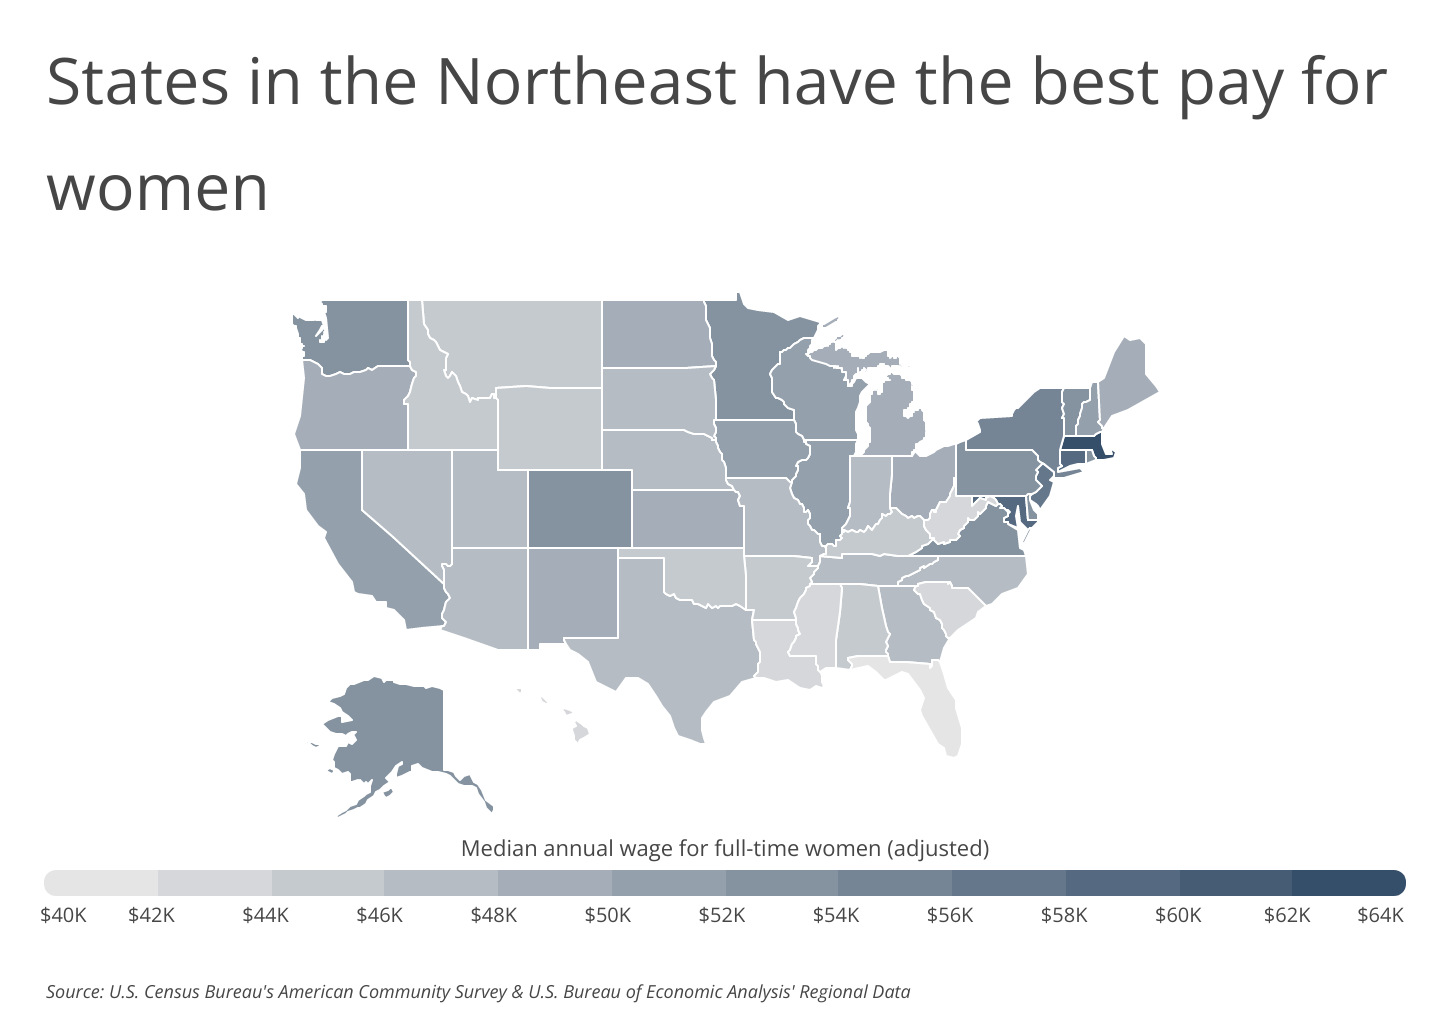
Women’s earnings are stronger in certain parts of the country than others, and the mix of occupations may be one reason why. States in the Northeast and on the West Coast tend to have higher median earnings for women after adjusting for cost of living. These locales also have economies that offer more professional occupations that pay high wages. Massachusetts leads all states with a median cost-of-living-adjusted wage for full-time women of $62,443, while Florida’s wages are the lowest at $41,633.
At the local level as well, cities with more professional occupations in fields like business, technology, finance, and law tend to offer higher wages for women. A number of major metros in the Northeast and Western U.S. rank highly as the best-paying cities for women, including the nation-leading San Jose metro, where the median female worker earns nearly $75,000 per year. Additionally, these locations with higher median wages for women tend to also have smaller wage gaps between women and men.
The data used in this analysis is from the U.S. Census Bureau and the U.S. Bureau of Economic Analysis. To determine the best-paying locations for women, researchers at Smartest Dollar calculated the median annual wage for women working full time, adjusted for the cost of living. In the event of a tie, the location with the greater unadjusted median annual wage for women working full time was ranked higher.
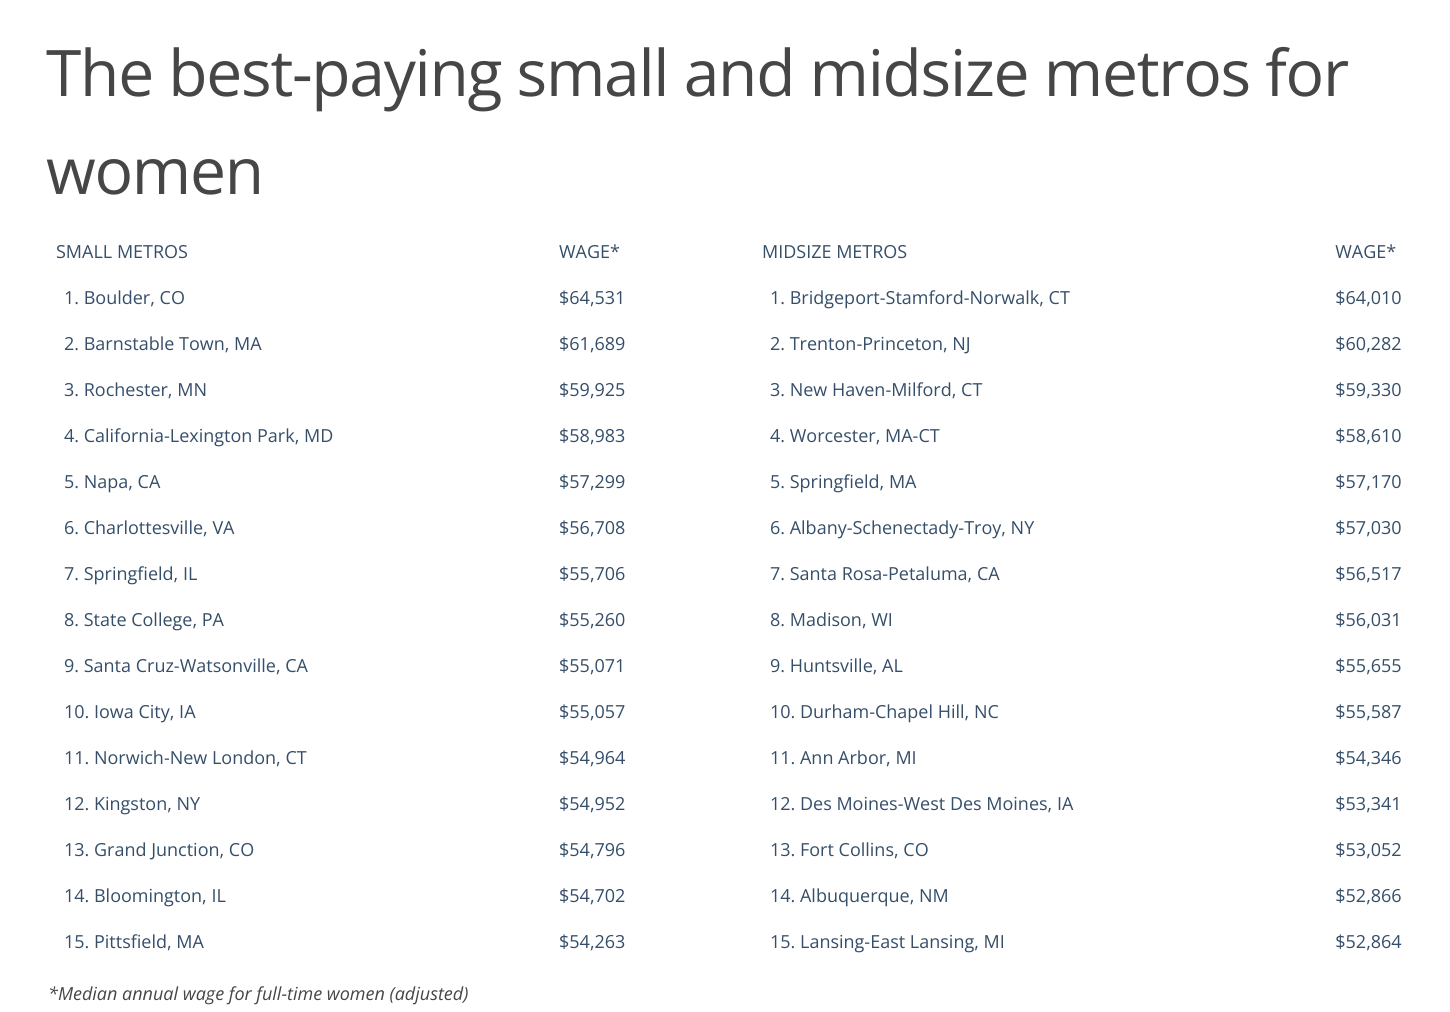
Here are the best-paying U.S. metropolitan areas for women.
The Best-Paying Large Metros for Women

Photo Credit: Agnieszka Gaul / Shutterstock
15. Columbus, OH
- Median annual wage for full-time women (adjusted): $54,428
- Median annual wage for full-time women (actual): $51,720
- Median annual wage for all full-time workers (adjusted): $56,759
- Percentage of women that work full time: 48.0%
- Cost of living (compared to average): -5.0%

Photo Credit: Richard Cavalleri / Shutterstock
14. Providence-Warwick, RI-MA
- Median annual wage for full-time women (adjusted): $54,598
- Median annual wage for full-time women (actual): $55,253
- Median annual wage for all full-time workers (adjusted): $60,982
- Percentage of women that work full time: 43.8%
- Cost of living (compared to average): +1.2%

Photo Credit: Andriy Blokhin / Shutterstock
13. Sacramento-Roseville-Folsom, CA
- Median annual wage for full-time women (adjusted): $54,681
- Median annual wage for full-time women (actual): $58,121
- Median annual wage for all full-time workers (adjusted): $63,703
- Percentage of women that work full time: 41.9%
- Cost of living (compared to average): +6.3%

Photo Credit: Farid Sani / Shutterstock
12. Raleigh-Cary, NC
- Median annual wage for full-time women (adjusted): $55,002
- Median annual wage for full-time women (actual): $53,671
- Median annual wage for all full-time workers (adjusted): $63,031
- Percentage of women that work full time: 46.6%
- Cost of living (compared to average): -2.4%

Photo Credit: Andrew Zarivny / Shutterstock
11. Denver-Aurora-Lakewood, CO
- Median annual wage for full-time women (adjusted): $55,182
- Median annual wage for full-time women (actual): $60,234
- Median annual wage for all full-time workers (adjusted): $65,358
- Percentage of women that work full time: 50.4%
- Cost of living (compared to average): +9.2%

Photo Credit: dibrova / Shutterstock
10. New York-Newark-Jersey City, NY-NJ-PA
- Median annual wage for full-time women (adjusted): $55,977
- Median annual wage for full-time women (actual): $64,138
- Median annual wage for all full-time workers (adjusted): $70,334
- Percentage of women that work full time: 43.6%
- Cost of living (compared to average): +14.6%

Photo Credit: photo.ua / Shutterstock
9. Minneapolis-St. Paul-Bloomington, MN-WI
- Median annual wage for full-time women (adjusted): $56,391
- Median annual wage for full-time women (actual): $58,411
- Median annual wage for all full-time workers (adjusted): $64,732
- Percentage of women that work full time: 48.9%
- Cost of living (compared to average): +3.6%

Photo Credit: f11photo / Shutterstock
8. Hartford-East Hartford-Middletown, CT
- Median annual wage for full-time women (adjusted): $57,493
- Median annual wage for full-time women (actual): $58,477
- Median annual wage for all full-time workers (adjusted): $65,828
- Percentage of women that work full time: 46.2%
- Cost of living (compared to average): +1.7%

Photo Credit: mahaloshine / Shutterstock
7. Seattle-Tacoma-Bellevue, WA
- Median annual wage for full-time women (adjusted): $57,595
- Median annual wage for full-time women (actual): $65,985
- Median annual wage for all full-time workers (adjusted): $76,679
- Percentage of women that work full time: 44.9%
- Cost of living (compared to average): +14.6%

Photo Credit: Sean Pavone / Shutterstock
6. Baltimore-Columbia-Towson, MD
- Median annual wage for full-time women (adjusted): $57,626
- Median annual wage for full-time women (actual): $60,514
- Median annual wage for all full-time workers (adjusted): $66,207
- Percentage of women that work full time: 50.7%
- Cost of living (compared to average): +5.0%

Photo Credit: Gang Liu / Shutterstock
5. Philadelphia-Camden-Wilmington, PA-NJ-DE-MD
- Median annual wage for full-time women (adjusted): $58,167
- Median annual wage for full-time women (actual): $57,707
- Median annual wage for all full-time workers (adjusted): $64,153
- Percentage of women that work full time: 46.7%
- Cost of living (compared to average): -0.8%

Photo Credit: ESB Professional / Shutterstock
4. Boston-Cambridge-Newton, MA-NH
- Median annual wage for full-time women (adjusted): $63,918
- Median annual wage for full-time women (actual): $70,111
- Median annual wage for all full-time workers (adjusted): $76,572
- Percentage of women that work full time: 47.0%
- Cost of living (compared to average): +9.7%

Photo Credit: Orhan Cam / Shutterstock
3. Washington-Arlington-Alexandria, DC-VA-MD-WV
- Median annual wage for full-time women (adjusted): $66,796
- Median annual wage for full-time women (actual): $74,370
- Median annual wage for all full-time workers (adjusted): $80,414
- Percentage of women that work full time: 51.0%
- Cost of living (compared to average): +11.3%

Photo Credit: Jessica Kirsh / Shutterstock
2. San Francisco-Oakland-Berkeley, CA
- Median annual wage for full-time women (adjusted): $67,175
- Median annual wage for full-time women (actual): $80,497
- Median annual wage for all full-time workers (adjusted): $88,414
- Percentage of women that work full time: 45.3%
- Cost of living (compared to average): +19.8%
Photo Credit: Uladzik Kryhin / Shutterstock
1. San Jose-Sunnyvale-Santa Clara, CA
- Median annual wage for full-time women (adjusted): $74,714
- Median annual wage for full-time women (actual): $83,414
- Median annual wage for all full-time workers (adjusted): $99,793
- Percentage of women that work full time: 45.2%
- Cost of living (compared to average): +11.6%
Detailed Findings & Methodology
The data used in this analysis is from the U.S. Census Bureau’s 2021 American Community Survey and the U.S. Bureau of Economic Analysis’ Regional Price Parities datasets. To determine the best-paying locations for women, researchers at Smartest Dollar calculated the median annual wage for women working full time, adjusted for the cost of living. In the event of a tie, the location with the greater unadjusted median annual wage for women working full time was ranked higher. To improve relevance, only metropolitan areas with at least 100,000 residents were included. Additionally, metros were grouped into cohorts based on population size: small (100,000–349,999), midsize (350,000–999,999), and large (1,000,000 or more).
By clicking the above links, you will go to one of our insurance partners. The specific companies listed above may not be included in our partner's network at this time.