American Cities With the Most Innovative Workers in 2022
Entrepreneurs, economic experts, public officials, and many more tout the benefits of innovation in the modern economy. Innovation can drive economic growth by creating new jobs or industries, improving efficiency and productivity, and raising quality of life. Some economists have calculated that innovation contributes approximately 50% of annual U.S. GDP growth.
Jobs in STEM (science, technology, engineering, and math) fields are most commonly thought of as quintessentially innovative fields. And it is true that new inventions, technologies, and scientific discoveries have rapidly reshaped society and the economy since the beginning of the Industrial Revolution.
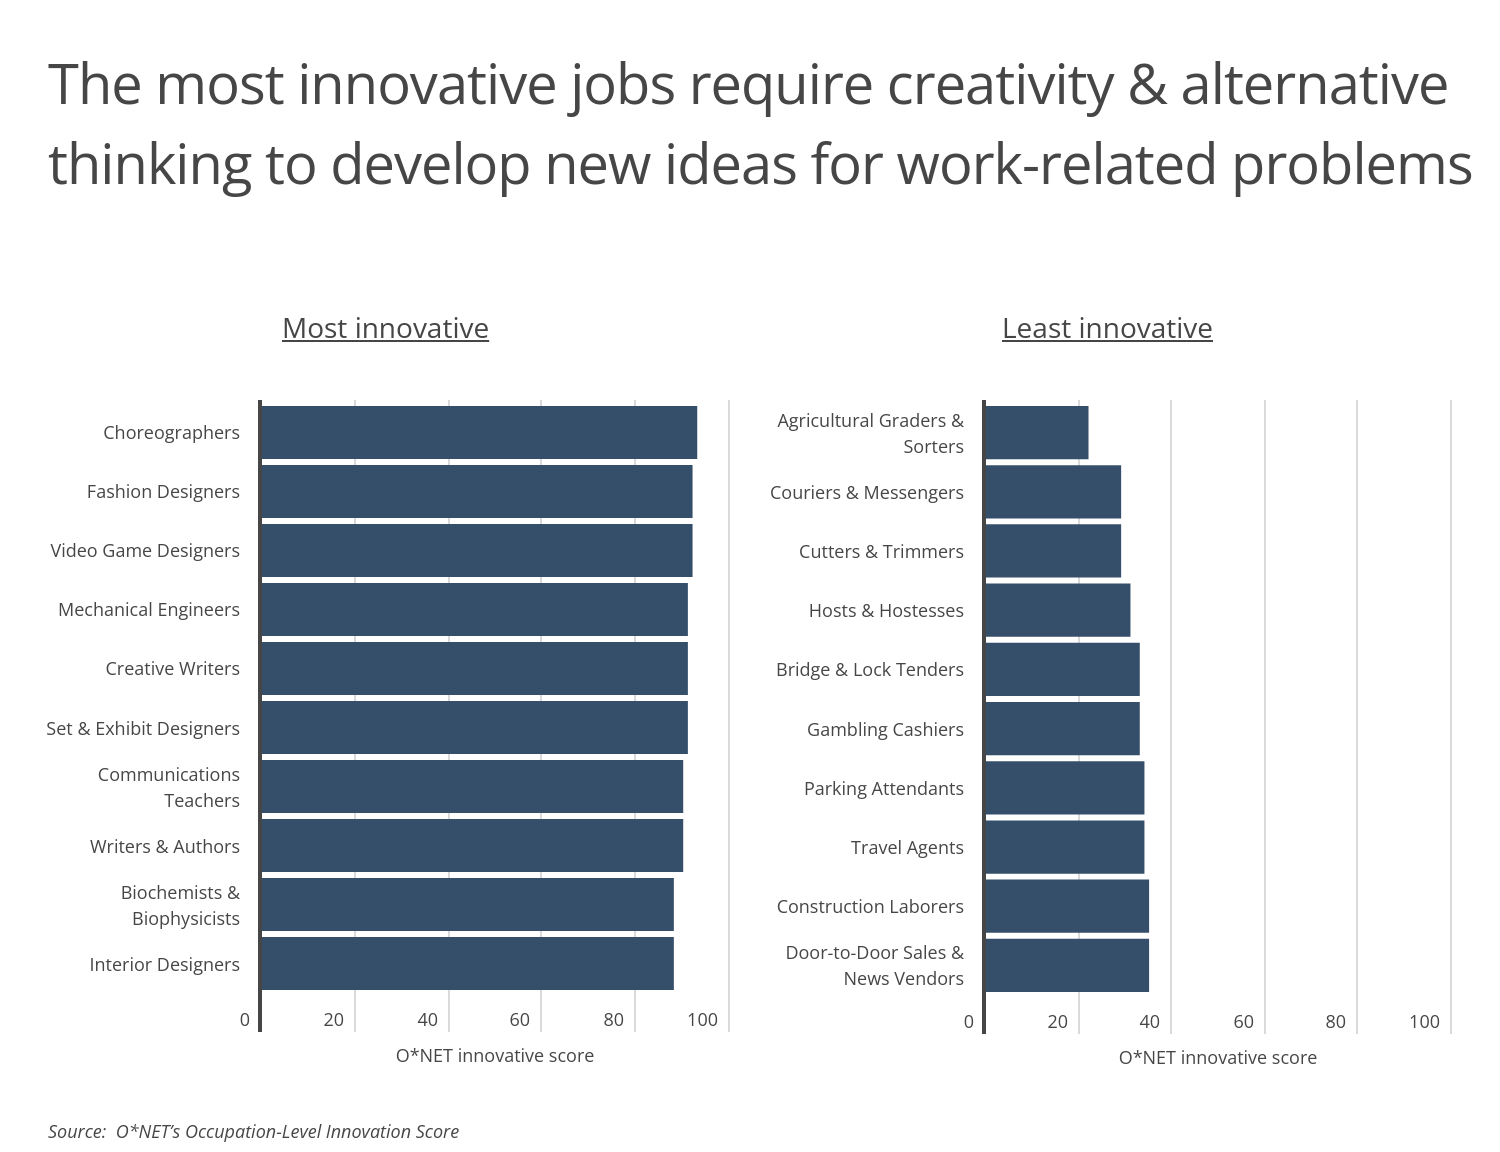
But in reality, innovation is not limited to STEM professions. The U.S. Bureau of Labor Statistics’ O*NET database defines innovative jobs as those requiring creativity and alternative thinking to develop new ideas for and answers to work-related problems. And under this definition, innovative jobs are found in a wide range of disciplines beyond STEM fields, from the arts to education to entertainment.
In fact, many of the most innovative jobs according to O*NET are found in the arts, including highly creative jobs like choreographers, poets/lyricists, and writers/authors. Innovative jobs also include STEM fields like mechanical engineering and biochemistry & biophysics, along with positions that bridge technology and the arts, like video game design. At the other end of the spectrum, the jobs that O*NET considers less innovative include positions that are primarily manual labor, like agricultural graders & sorters or cutters & trimmers, or service jobs, like hosts & hostesses or parking attendants.
RELATED
If you operate your own business, it’s important to be properly insured. A good starting place is a business owners policy, which includes both commercial property coverage and general liability insurance.
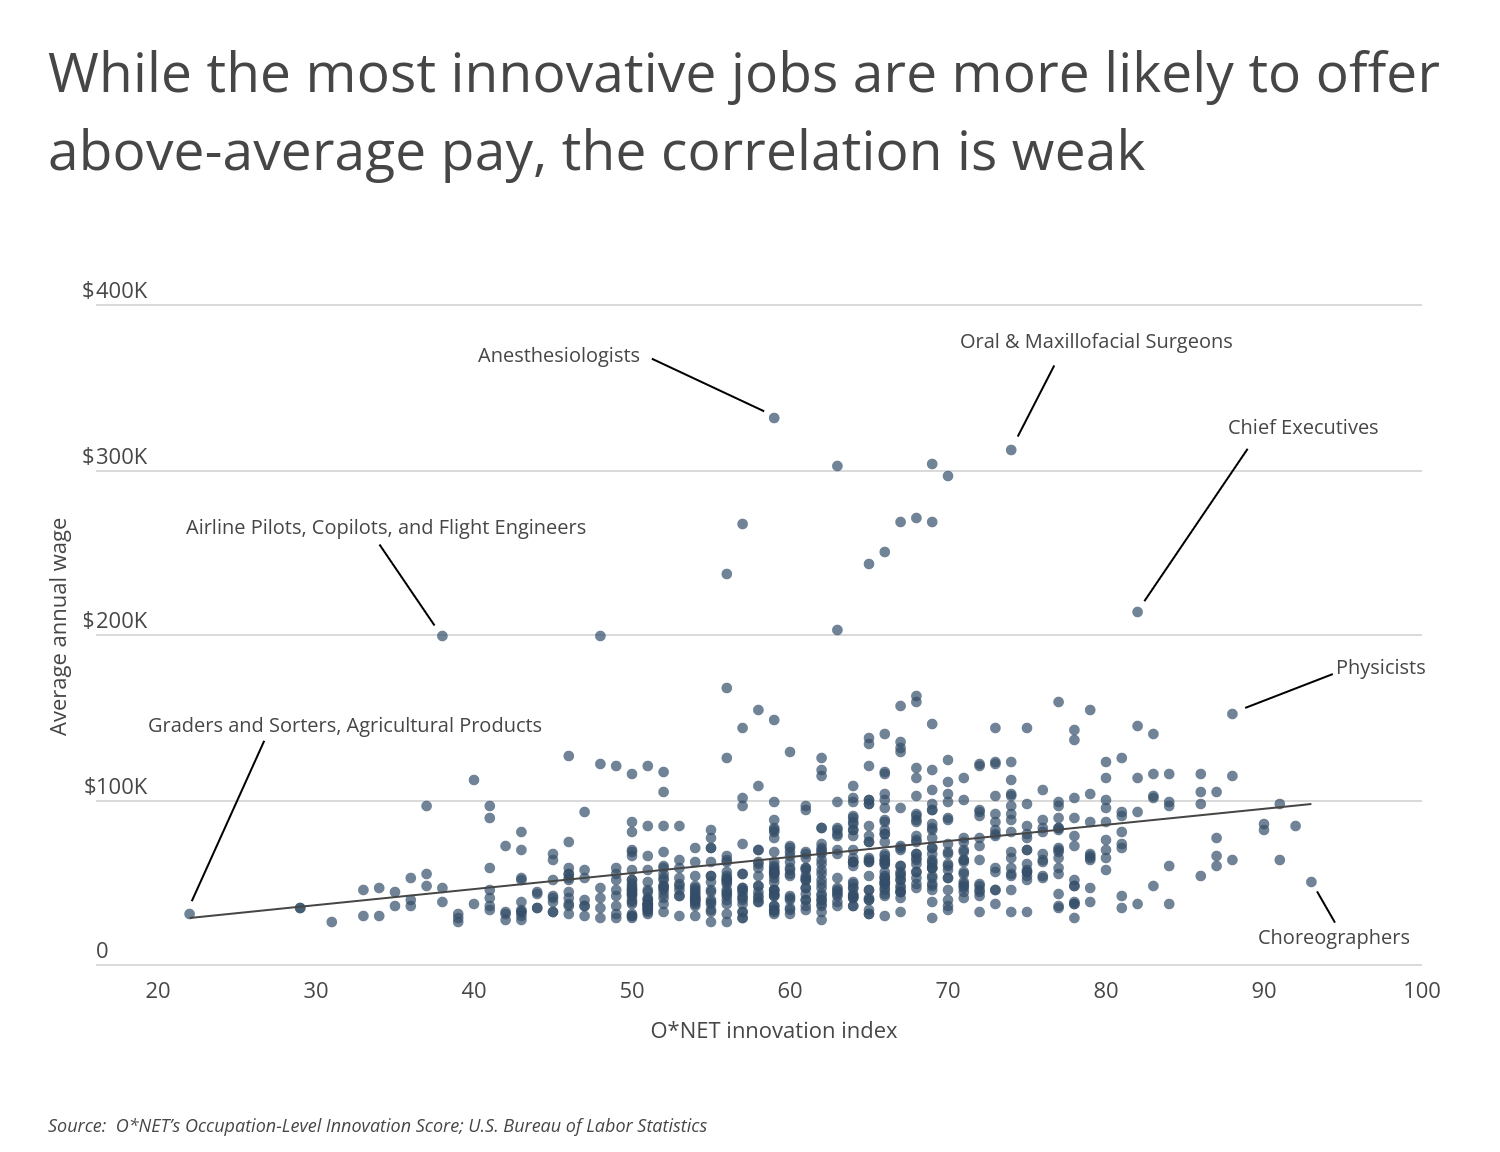
Given these qualities, it may also be easy to assume that more innovative jobs pay higher wages and less innovative jobs pay lower wages. In reality, there is a correlation between a job’s level of innovation and annual wages, but the correlation is weak. While many innovative jobs in STEM fields pay well, it is also the case that a relatively low-innovation job like airline pilot has an average wage near $200,000, while the high-innovation job of choreographer has an average wage of less than $50,000.
FOR BUSINESS OWNERS
If your business provides professional services or advice to others, it should have professional liability coverage. On the other hand, businesses that manufacture or sell physical products should be covered by products liability insurance.
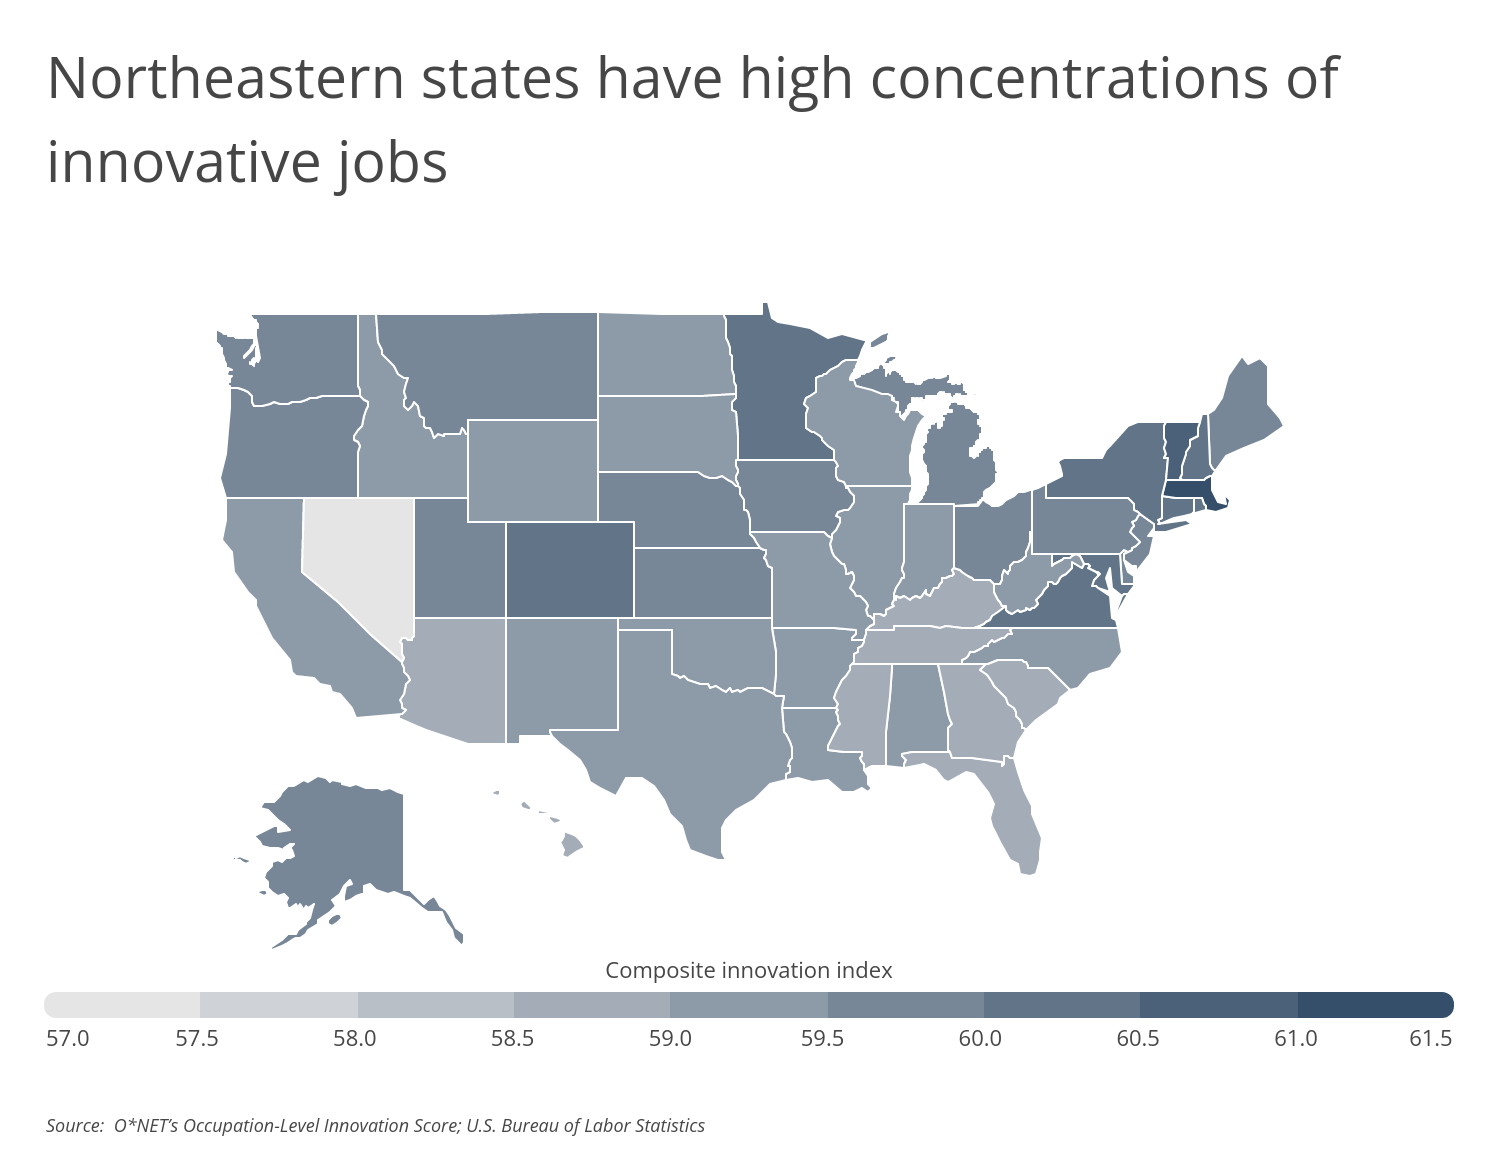
Innovative jobs are also unevenly distributed by geography. Many of the states that have higher overall levels of innovative jobs are found in the Northeast, including nation-leading Massachusetts. Most of these top states have higher levels of educational attainment that may qualify more residents for more specialized, innovative jobs. In contrast, the state with the lowest overall concentration of innovative jobs is Nevada. Much of Nevada’s economy is oriented toward gaming, tourism, and hospitality-industries that tend to have less innovative jobs.
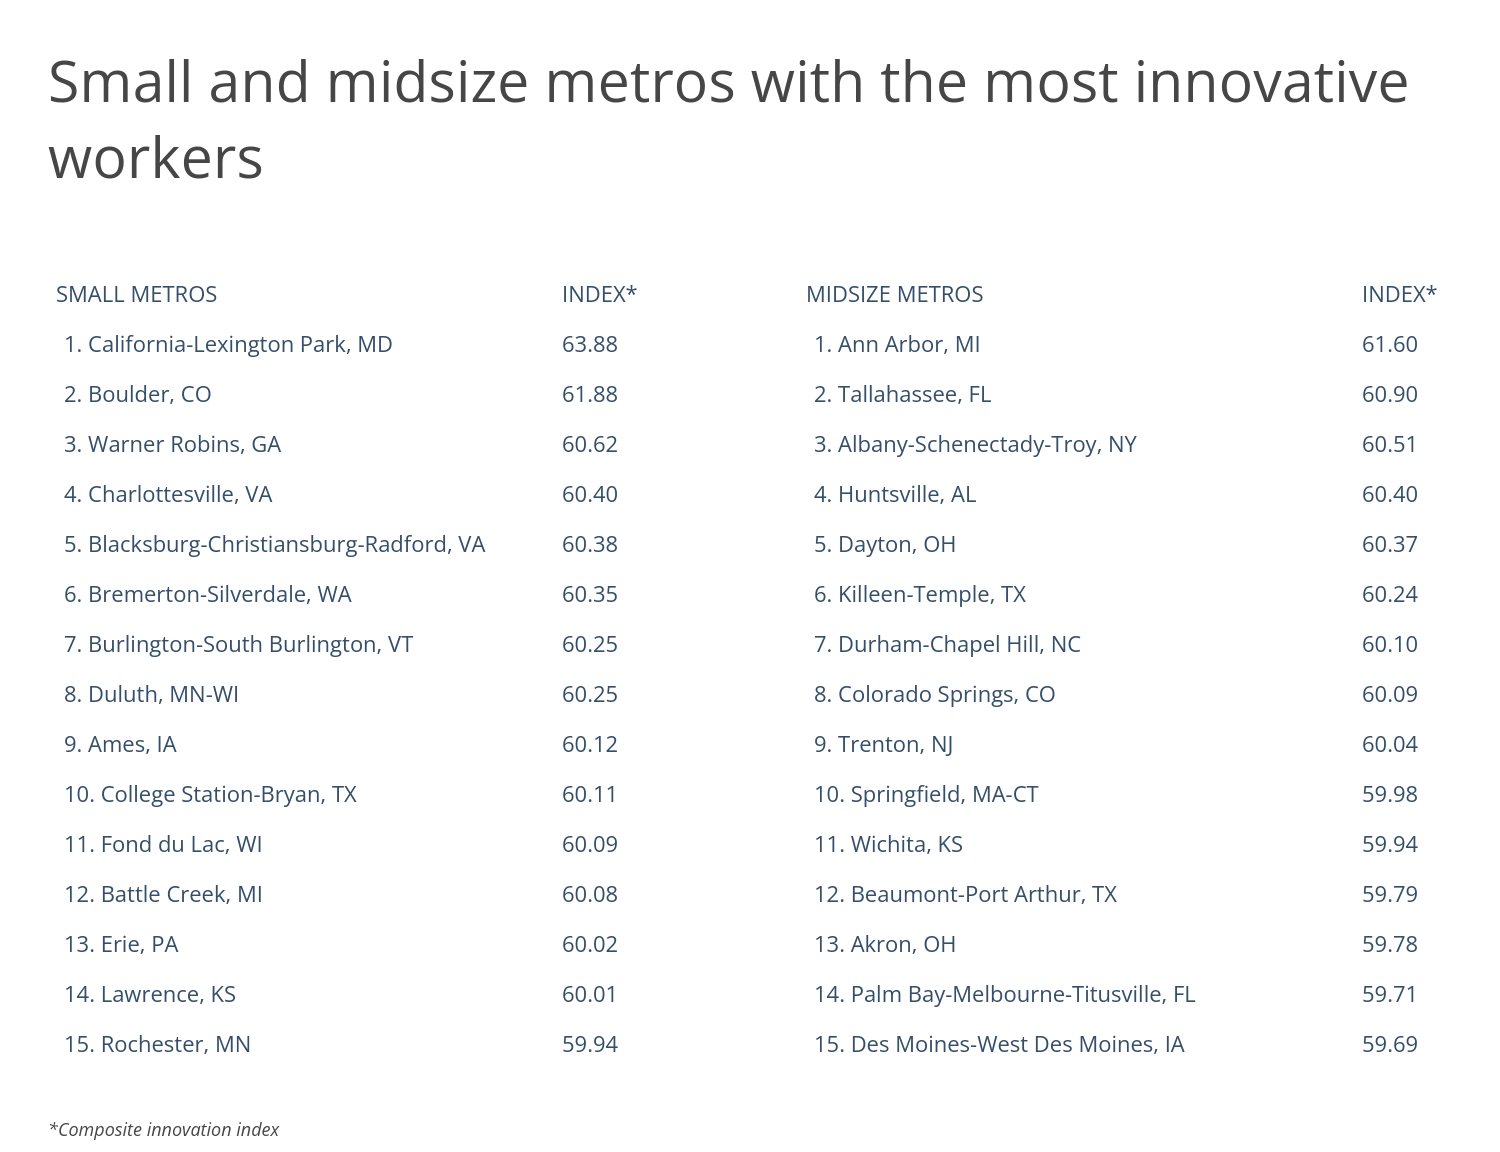
At the metro level, the list of cities with the most innovative workers includes knowledge economy hotspots like Austin, Boston, and Denver. But many of the other leading cities for innovative workers are Rust Belt locations like Detroit, Cleveland, and Rochester. In these manufacturing-heavy economies, certain types of innovative jobs, from mechanical engineers to materials scientists to model makers, are more highly concentrated than in other parts of the U.S.
The data used in this analysis is from O*NET and the U.S. Bureau of Labor Statistics. To determine the locations with the most innovative workers, researchers at Smartest Dollar-a review website for small business insurance-calculated a composite innovation index for each location. The composite innovation index is an employment-weighted average of the occupation-level innovation scores for each location. In the event of a tie, the location with the greater share of workers in the most innovative jobs-those with an O*NET score of 80 or above-was ranked higher.
Here are the U.S. metropolitan areas with the most innovative workers.
Large Metros With the Most Innovative Workers

Photo Credit: Mihai_Andritoiu / Shutterstock
15. Providence-Warwick, RI-MA
- Composite innovation index: 59.45
- Share of workers in the most innovative jobs: 3.2%
- Total workers in the most innovative jobs: 17,000
- Average annual wage for all workers: $60,530
- Average annual wage for workers in the most innovative jobs: $85,627

Photo Credit: Sean Pavone / Shutterstock
14. Milwaukee-Waukesha-West Allis, WI
- Composite innovation index: 59.45
- Share of workers in the most innovative jobs: 3.4%
- Total workers in the most innovative jobs: 26,590
- Average annual wage for all workers: $56,190
- Average annual wage for workers in the most innovative jobs: $77,605

Photo Credit: doma / Shutterstock
13. Cincinnati, OH-KY-IN
- Composite innovation index: 59.50
- Share of workers in the most innovative jobs: 3.4%
- Total workers in the most innovative jobs: 34,480
- Average annual wage for all workers: $54,910
- Average annual wage for workers in the most innovative jobs: $81,629

Photo Credit: AevanStock / Shutterstock
12. Pittsburgh, PA
- Composite innovation index: 59.58
- Share of workers in the most innovative jobs: 2.8%
- Total workers in the most innovative jobs: 29,240
- Average annual wage for all workers: $56,060
- Average annual wage for workers in the most innovative jobs: $75,208

Photo Credit: Henryk Sadura / Shutterstock
11. Grand Rapids-Wyoming, MI
- Composite innovation index: 59.61
- Share of workers in the most innovative jobs: 3.5%
- Total workers in the most innovative jobs: 17,750
- Average annual wage for all workers: $52,660
- Average annual wage for workers in the most innovative jobs: $69,637

Photo Credit: Dave Riewe / Shutterstock
10. Minneapolis-St. Paul-Bloomington, MN-WI
- Composite innovation index: 59.78
- Share of workers in the most innovative jobs: 3.6%
- Total workers in the most innovative jobs: 65,960
- Average annual wage for all workers: $63,990
- Average annual wage for workers in the most innovative jobs: $83,195

Photo Credit: f11photo / Shutterstock
9. Hartford-West Hartford-East Hartford, CT
- Composite innovation index: 59.83
- Share of workers in the most innovative jobs: 2.6%
- Total workers in the most innovative jobs: 14,030
- Average annual wage for all workers: $67,140
- Average annual wage for workers in the most innovative jobs: $83,451

Photo Credit: Andrew Zarivny / Shutterstock
8. Denver-Aurora-Lakewood, CO
- Composite innovation index: 59.91
- Share of workers in the most innovative jobs: 3.6%
- Total workers in the most innovative jobs: 52,340
- Average annual wage for all workers: $66,750
- Average annual wage for workers in the most innovative jobs: $85,378

Photo Credit: Daniel Novak / Shutterstock
7. Buffalo-Cheektowaga-Niagara Falls, NY
- Composite innovation index: 59.92
- Share of workers in the most innovative jobs: 2.8%
- Total workers in the most innovative jobs: 14,070
- Average annual wage for all workers: $56,140
- Average annual wage for workers in the most innovative jobs: $76,041

Photo Credit: f11photo / Shutterstock
6. Baltimore-Columbia-Towson, MD
- Composite innovation index: 59.95
- Share of workers in the most innovative jobs: 3.0%
- Total workers in the most innovative jobs: 37,920
- Average annual wage for all workers: $64,500
- Average annual wage for workers in the most innovative jobs: $94,731

Photo Credit: Rudy Balasko / Shutterstock
5. Cleveland-Elyria, OH
- Composite innovation index: 59.98
- Share of workers in the most innovative jobs: 3.4%
- Total workers in the most innovative jobs: 32,460
- Average annual wage for all workers: $55,860
- Average annual wage for workers in the most innovative jobs: $79,598

Photo Credit: George Raymond Gibbs / Shutterstock
4. Rochester, NY
- Composite innovation index: 60.09
- Share of workers in the most innovative jobs: 2.5%
- Total workers in the most innovative jobs: 11,740
- Average annual wage for all workers: $56,830
- Average annual wage for workers in the most innovative jobs: $70,092

Photo Credit: Sergey Novikov / Shutterstock
3. Detroit-Warren-Dearborn, MI
- Composite innovation index: 60.21
- Share of workers in the most innovative jobs: 4.1%
- Total workers in the most innovative jobs: 73,810
- Average annual wage for all workers: $59,060
- Average annual wage for workers in the most innovative jobs: $86,951

Photo Credit: Travellaggio / Shutterstock
2. Boston-Cambridge-Nashua, MA-NH
- Composite innovation index: 60.23
- Share of workers in the most innovative jobs: 3.0%
- Total workers in the most innovative jobs: 78,220
- Average annual wage for all workers: $76,850
- Average annual wage for workers in the most innovative jobs: $98,387

Photo Credit: Sean Pavone / Shutterstock
1. Austin-Round Rock, TX
- Composite innovation index: 60.36
- Share of workers in the most innovative jobs: 3.2%
- Total workers in the most innovative jobs: 34,150
- Average annual wage for all workers: $60,260
- Average annual wage for workers in the most innovative jobs: $81,527
Detailed Findings & Methodology
The data used in this analysis is from O*NET’s Occupation-Level Innovation Score and the U.S. Bureau of Labor Statistics Occupational Employment and Wage Statistics. To determine the locations with the most innovative workers, researchers calculated a composite innovation index for each location. The composite innovation index is an employment-weighted average of the occupation-level innovation scores for each location. In the event of a tie, the location with the greater share of workers in the most innovative jobs-those with an O*NET score of 80 or above-was ranked higher. To improve relevance, only metropolitan areas with at least 100,000 residents were included. Additionally, metros were grouped into cohorts based on population size: small (100,000–349,999), midsize (350,000–999,999), and large (1,000,000 or more).
By clicking the above links, you will go to one of our insurance partners. The specific companies listed above may not be included in our partner's network at this time.