U.S. Cities With the Most New Businesses per Capita [2022 Edition]
Entrepreneurship is one of the most powerful forces in the U.S. economy. The Small Business Administration classifies 13% of all establishments as startups and estimates that there are a total of 31.7 million small businesses in the U.S. Economic experts, policymakers, and business leaders all tout these new and developing enterprises as essential for job creation and innovation. Even major companies publicly mythologize their humble origins, from tech companies founded in garages to mom-and-pop shops or restaurants grown into nationwide chains.
However, startup businesses and their role in the economy have changed over time. As larger companies increasingly concentrate their strength in the market, startups are representing a declining share of total employment in the U.S. Simultaneously, microbusinesses in fields like online retail have become an increasingly large portion of new businesses. These enterprises are easier to start, which has helped diversify the ranks of business founders, but they may not grow to a large scale or add many employees-or any at all.
FOR NEW BUSINESSES
For new businesses, effectively managing risk is one of the most important factors for determining success. And as an increasing number of businesses store sensitive customer information on their computer systems, mitigating the risk of cyber attacks is something that shouldn’t be overlooked. Cyber liability insurance is a type of coverage that protects businesses from losses incurred by a data breach or cyber attack. This is different from commercial crime coverage, which covers monetary losses from non-cyber-related criminal activity.
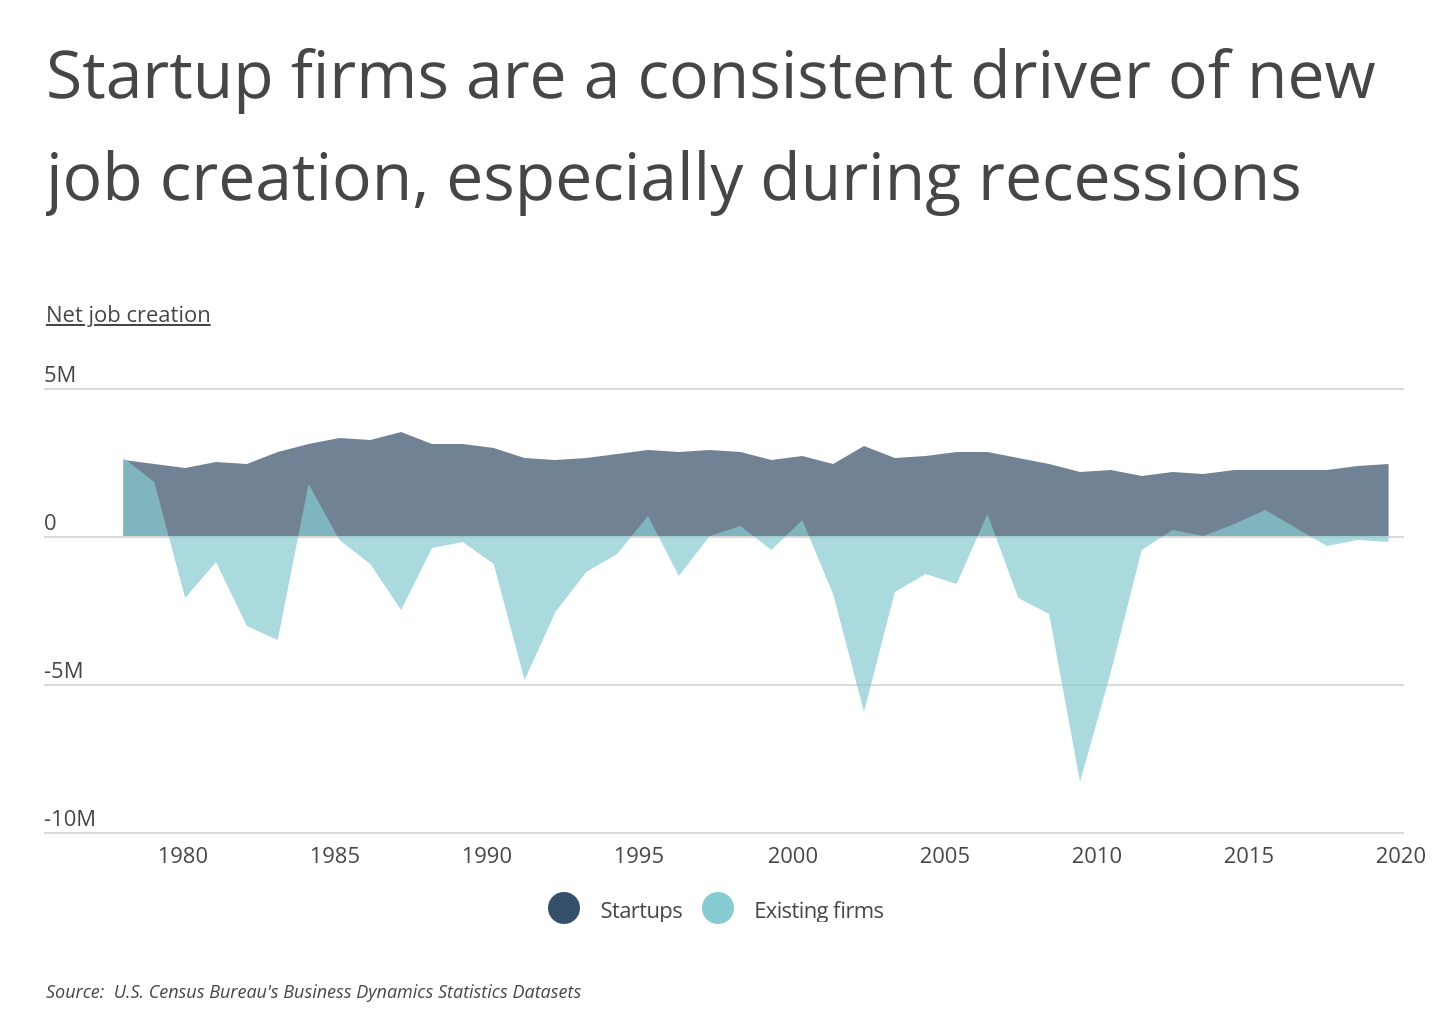
Historically, however, startups have been a greater engine of job creation than established firms, typically producing between two and three million new jobs per year. And with experts currently expressing recession fears amid high inflation, rising interest rates, and cooling consumer demand, new businesses could be a key force to help stabilize the economy in the next couple of years. Startups continue creating jobs even during economic downturns, while established companies are more likely to shed employees as a cost-saving measure.
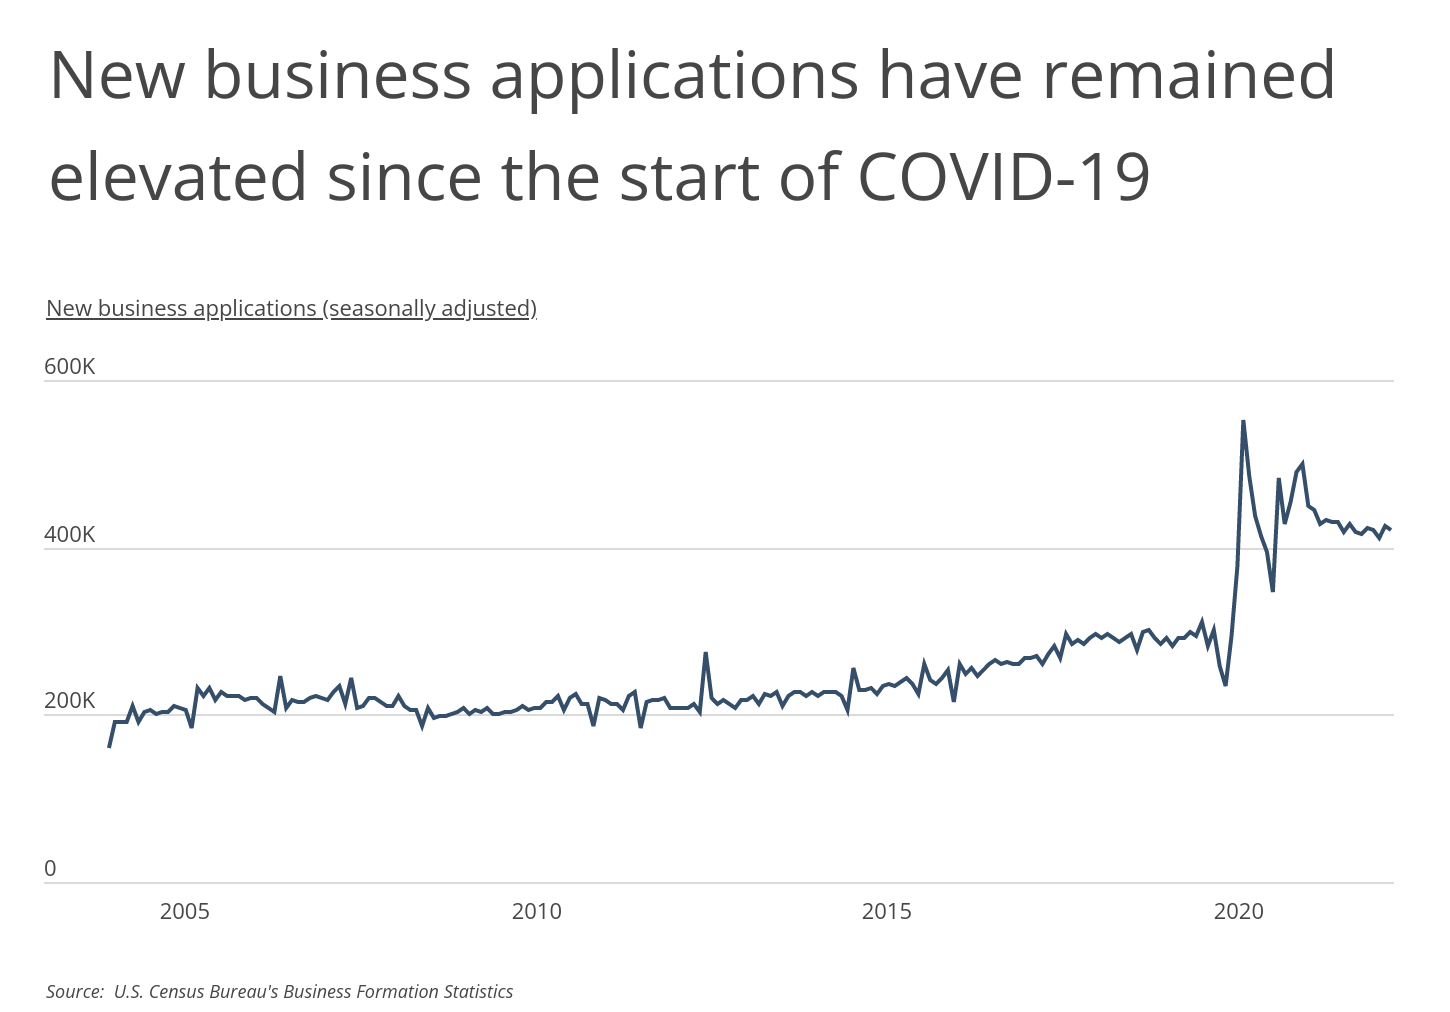
Despite fears of a downturn, one reason for continued economic optimism is an elevated level of new business creation since the start of COVID-19. The U.S. has averaged more than 400,000 monthly applications for new businesses since the pandemic began. In comparison, the highest single month for new business applications from 2004 until the start of the pandemic saw around 309,000 applications.
One major reason for this boom in new businesses was access to capital. Government stimulus, low interest rates, and fast-rising values for homes, stocks, and other assets through 2020 and 2021 gave more people access to the financial resources needed to start businesses. Another related factor was the Great Resignation, as record-high numbers of workers left jobs in search of better economic opportunities-many of whom started new businesses.
State and local policymakers will also say that business-friendly policies in their jurisdictions help motivate business creation, and indeed the concentration of new business applications varies by geography. Some states attract new businesses by cutting corporate and personal income taxes, while others have fewer licensing and insurance requirements that small businesses must contend with. As an example, Texas doesn’t require most businesses to carry workers’ compensation insurance, and other states waive the requirement for businesses below certain size thresholds.
FOR BUSINESS OWNERS
For businesses that already have a wide range of small business insurance, having a commercial umbrella policy can protect against catastrophic events in which losses exceed underlying policy limits.
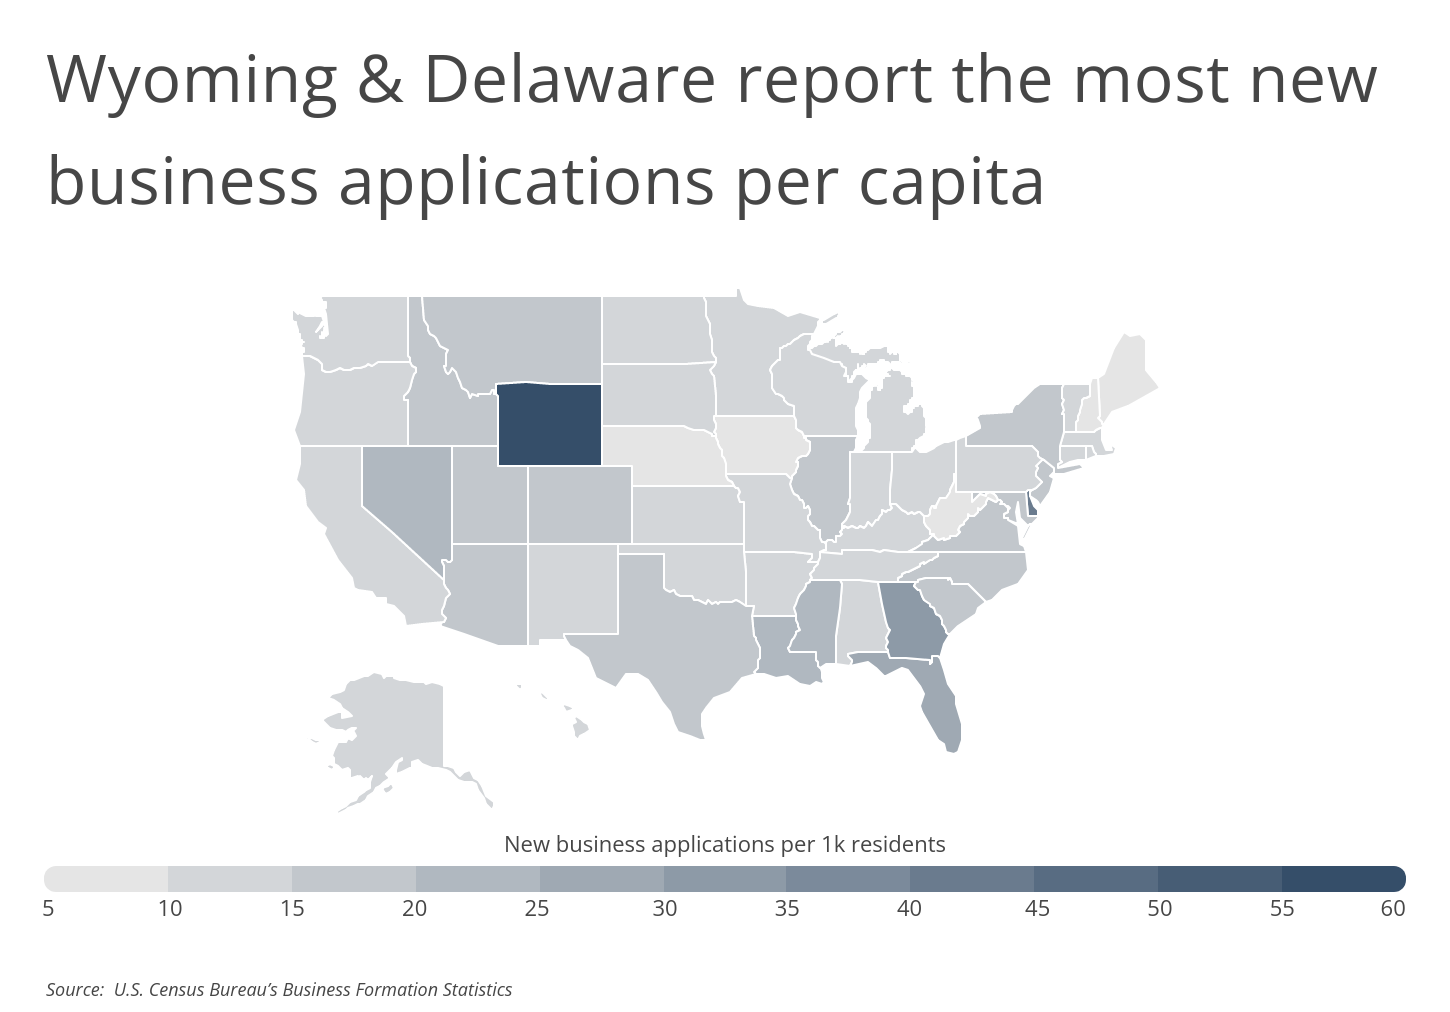
At the state level, Wyoming leads the U.S. with 58.12 new business applications per 1,000 residents-potentially a product of the state’s low population, but also its lack of income taxes-–while Delaware, a famously business-friendly state, comes in second at 44.98. Other more active states for new business tend to be found in the South, while New England and the Midwest have lower levels of new business applications.
Among metro areas, however, Florida’s cities stand out as the nation’s leaders in new business formation. With a fast-growing population, low taxes, and other business-friendly attributes, the Sunshine State is home to four of the top six major cities for new businesses per capita.
The data used in this study is from the U.S. Census Bureau. To determine the locations with the most new businesses per capita, researchers at Smartest Dollar-a website that compares small business insurance and products-calculated the number of new business applications per 1,000 residents for the year 2021. In the event of a tie, the location with the greater total number of business applications in 2021 was ranked higher. Researchers also provided statistics on the one-year (2020–2021) and two-year (2019–2021) change in new business applications.
Here are the U.S. metropolitan areas with the most new businesses per capita.
Large U.S. Metros With the Most New Businesses

Photo Credit: Gang Liu / Shutterstock
15. Philadelphia-Camden-Wilmington, PA-NJ-DE-MD
- New business applications per 1k residents: 20.49
- Total new business applications (2021): 127,969
- 1-year change in new business applications: +27.5%
- 2-year change in new business applications: +70.0%

Photo Credit: Roschetzky Photography / Shutterstock
14. Austin-Round Rock-Georgetown, TX
- New business applications per 1k residents: 20.51
- Total new business applications (2021): 46,835
- 1-year change in new business applications: +34.5%
- 2-year change in new business applications: +52.4%

Photo Credit: Sean Pavone / Shutterstock
13. Detroit-Warren-Dearborn, MI
- New business applications per 1k residents: 20.81
- Total new business applications (2021): 91,417
- 1-year change in new business applications: +11.0%
- 2-year change in new business applications: +65.4%

Photo Credit: Andrew Zarivny / Shutterstock
12. Denver-Aurora-Lakewood, CO
- New business applications per 1k residents: 21.00
- Total new business applications (2021): 62,226
- 1-year change in new business applications: +15.9%
- 2-year change in new business applications: +28.2%

Photo Credit: f11photo / Shutterstock
11. Dallas-Fort Worth-Arlington, TX
- New business applications per 1k residents: 21.02
- Total new business applications (2021): 160,518
- 1-year change in new business applications: +25.8%
- 2-year change in new business applications: +62.6%

Photo Credit: nektofadeev / Shutterstock
10. Houston-The Woodlands-Sugar Land, TX
- New business applications per 1k residents: 21.20
- Total new business applications (2021): 150,971
- 1-year change in new business applications: +27.5%
- 2-year change in new business applications: +75.2%

Photo Credit: Jon Bilous / Shutterstock
9. Charlotte-Concord-Gastonia, NC-SC
- New business applications per 1k residents: 21.65
- Total new business applications (2021): 57,600
- 1-year change in new business applications: +26.1%
- 2-year change in new business applications: +70.8%

Photo Credit: Andrey Bayda / Shutterstock
8. Las Vegas-Henderson-Paradise, NV
- New business applications per 1k residents: 24.42
- Total new business applications (2021): 55,319
- 1-year change in new business applications: +30.0%
- 2-year change in new business applications: +64.8%

Photo Credit: Sean Pavone / Shutterstock
7. Memphis, TN-MS-AR
- New business applications per 1k residents: 24.83
- Total new business applications (2021): 33,218
- 1-year change in new business applications: +25.1%
- 2-year change in new business applications: +122.6%

Photo Credit: GagliardiPhotography / Shutterstock
6. Jacksonville, FL
- New business applications per 1k residents: 25.18
- Total new business applications (2021): 40,436
- 1-year change in new business applications: +29.3%
- 2-year change in new business applications: +70.7%

Photo Credit: Kevin J King / Shutterstock
5. Tampa-St. Petersburg-Clearwater, FL
- New business applications per 1k residents: 25.22
- Total new business applications (2021): 80,089
- 1-year change in new business applications: +27.4%
- 2-year change in new business applications: +63.2%

Photo Credit: Sean Pavone / Shutterstock
4. New Orleans-Metairie, LA
- New business applications per 1k residents: 25.65
- Total new business applications (2021): 32,617
- 1-year change in new business applications: +9.1%
- 2-year change in new business applications: +69.4%

Photo Credit: Songquan Deng / Shutterstock
3. Orlando-Kissimmee-Sanford, FL
- New business applications per 1k residents: 30.76
- Total new business applications (2021): 82,239
- 1-year change in new business applications: +28.6%
- 2-year change in new business applications: +68.1%

Photo Credit: ESB Professional / Shutterstock
2. Atlanta-Sandy Springs-Alpharetta, GA
- New business applications per 1k residents: 39.05
- Total new business applications (2021): 237,781
- 1-year change in new business applications: +17.0%
- 2-year change in new business applications: +83.4%

Photo Credit: Sean Pavone / Shutterstock
1. Miami-Fort Lauderdale-Pompano Beach, FL
- New business applications per 1k residents: 44.14
- Total new business applications (2021): 270,966
- 1-year change in new business applications: +24.0%
- 2-year change in new business applications: +58.6%
Methodology & Detailed Findings
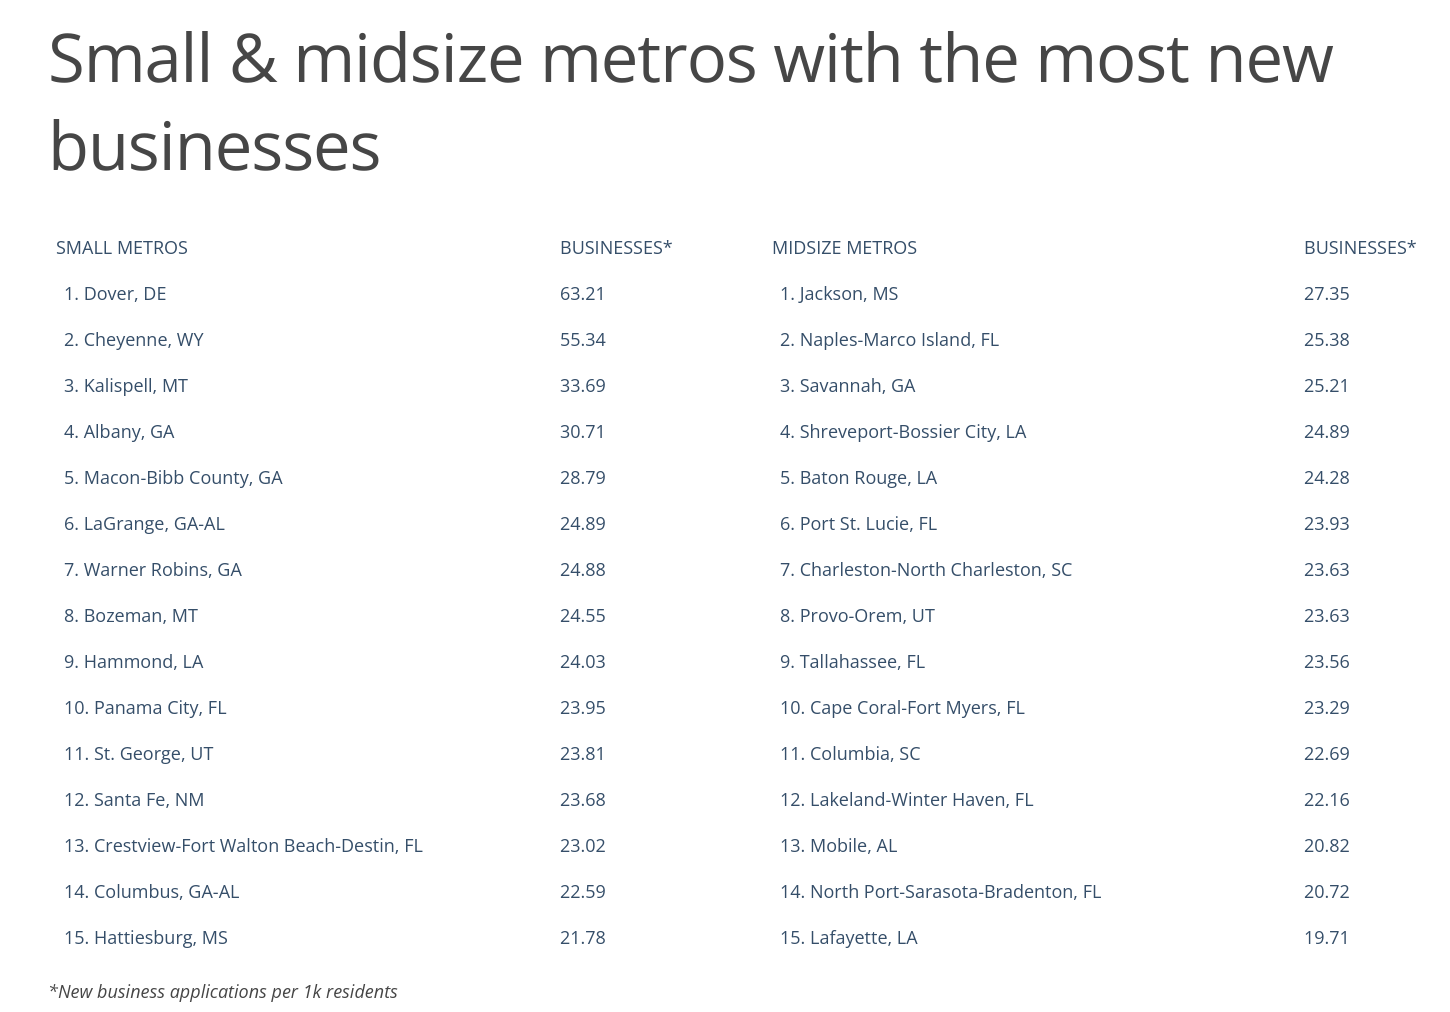
The data used in this study is from the U.S. Census Bureau’s Business Formation Statistics dataset. To determine the locations with the most new businesses per capita researchers at Smartest Dollar calculated the number of new business applications per 1,000 residents for the year 2021. In the event of a tie, the location with the greater total number of business applications in 2021 was ranked higher. Researchers also provided statistics on the one-year (2020–2021) and two-year (2019–2021) change in new business applications. To improve relevance, only locations with at least 100,000 residents were included. Metropolitan areas were further grouped based on population size: small (100,000–349,999), midsize (350,000–999,999), and large (1,000,000+).
By clicking the above links, you will go to one of our insurance partners. The specific companies listed above may not be included in our partner's network at this time.